
From Betting to Trading: How Kalshi is Reshaping Sports Markets
Key Takeaways
- Kalshi has scaled rapidly, driven by sports markets. Monthly notional volume grew 80x from $180M in early 2025 to $14.4B in March 2026. Sports account for 68% of total volume, rising 18x from $540M to $9.9B in three quarters.
- Prices are accurate and informationally efficient. Across 3.1K games representing $8.5B in notional volume, implied probabilities deviate by just 5.5%, with prices converging toward outcomes well before games begin.
- Arbitrage opportunities are limited in practice. Prices track sportsbooks closely, with correlations as high as 0.996, but a 2.75% cost threshold and thin in-game liquidity mean few intervals are arbitrageable, and these gaps are short-lived.
- Institutional flow is constrained today but improving. Higher fees and thinner in-game liquidity push larger bettors toward sportsbooks, but rising competition is likely to drive fee compression and stronger liquidity incentives over time.
- Structural advantages over sportsbooks drive growth. As a CFTC-regulated exchange, Kalshi offers nationwide access, no stake limits, and continuous trading, enabling more flexible capital deployment than traditional sportsbooks.
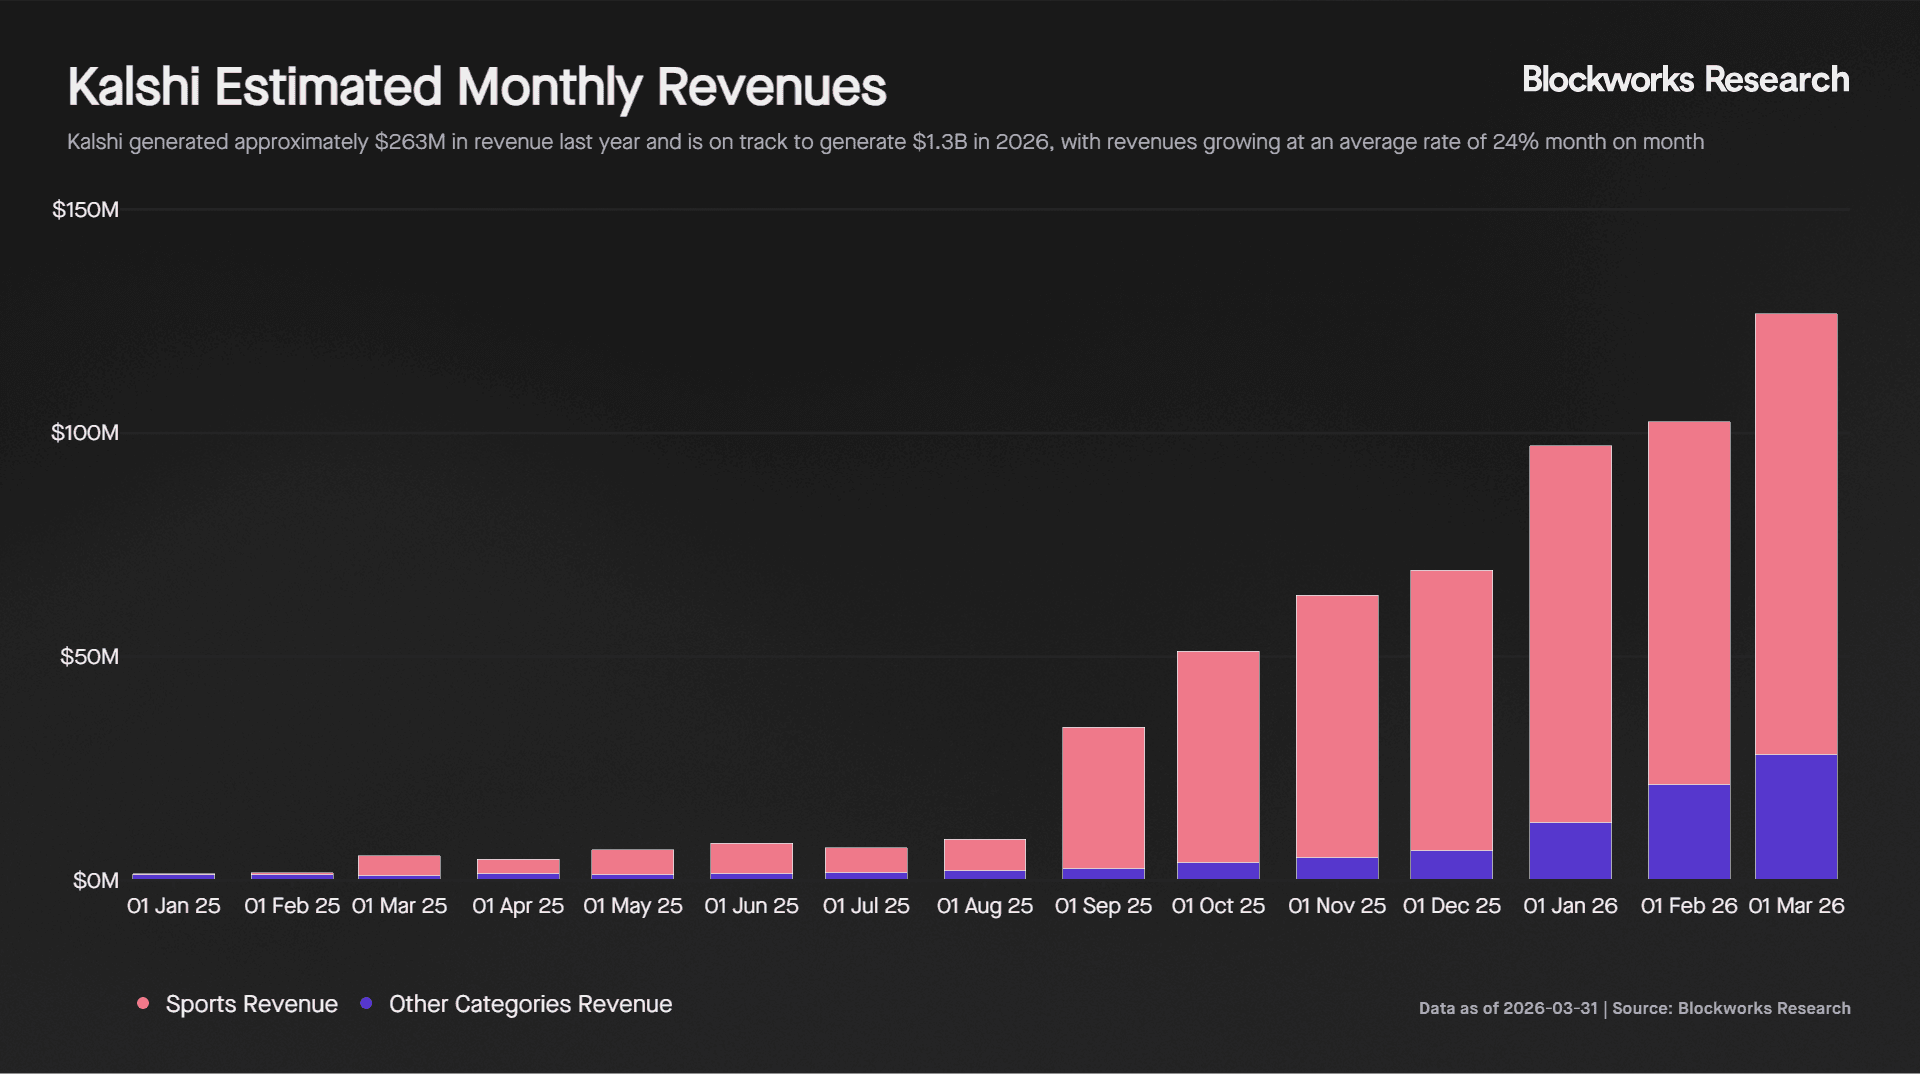
- Kalshi is smaller than incumbents but growing significantly faster. Estimated 2026 revenue is around $1.3B, up from $263M the prior year, compared to $6.1B for DraftKings and $16.4B for Flutter, but with materially higher growth rates.
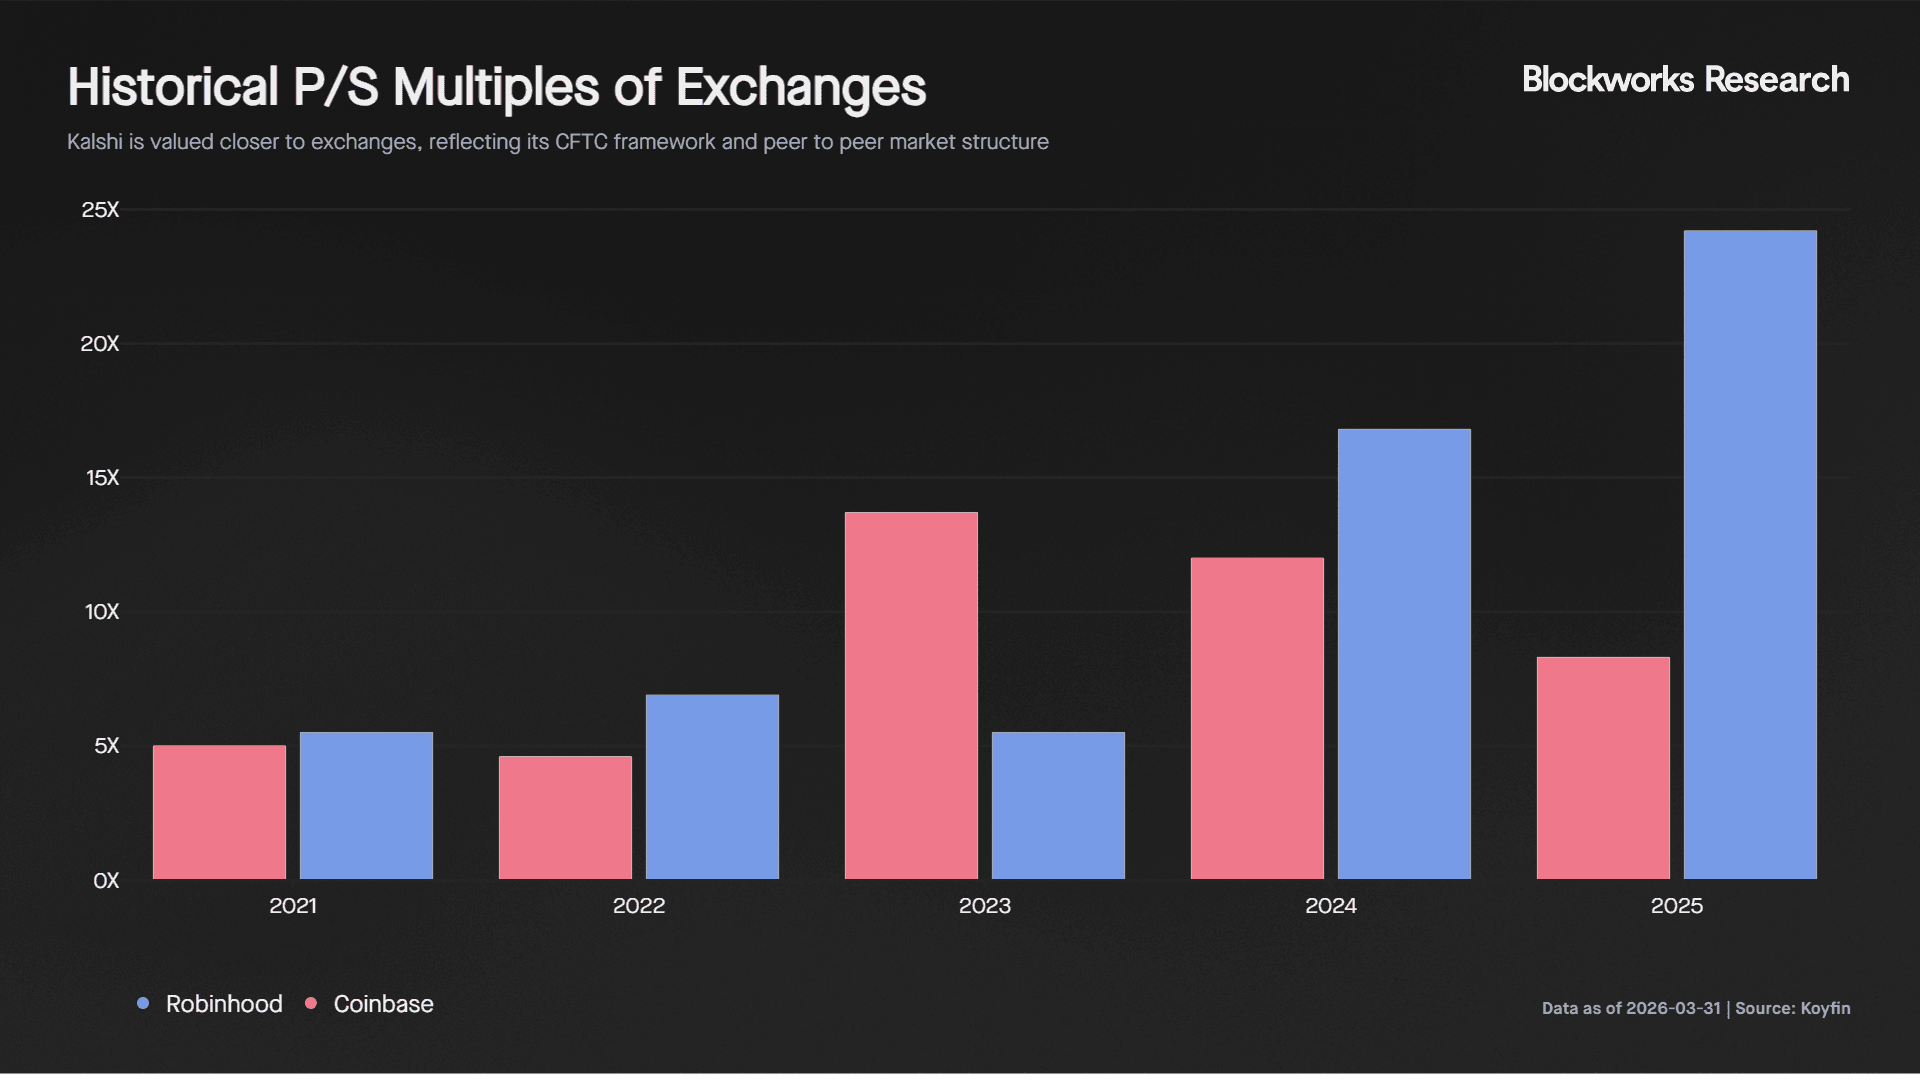
- Kalshi is being valued as an exchange, not a sportsbook. At a $22B valuation and 16.9x forward sales, it trades well above sportsbook multiples of 2x to 4x, aligning more closely with exchange-like platforms such as Coinbase and Robinhood.
Introduction
Prediction markets have quickly evolved from niche products into a meaningful financial primitive. While early adoption was driven by the 2024 US Presidential Elections, these markets have since expanded into new categories, with sports emerging as one of the largest and fastest growing segments. This shift comes against the backdrop of a $167B US sports betting market that continues to grow but remains structurally unfavorable to participants due to built-in margins and house-controlled pricing.
In contrast, prediction markets operate as peer-to-peer exchanges, where prices reflect probabilities set by participants rather than odds set by a house. This creates a more transparent pricing mechanism that resembles financial markets, where price discovery is driven by information flow and participant behavior.
In this report, we analyze Kalshi’s growth and examine the market structure of its sports products. We assess pricing accuracy, liquidity across the lifecycle of a game, and how these markets compare to traditional sportsbooks. We evaluate whether pricing differences create actionable trading opportunities, identify the structural drivers of adoption, and benchmark Kalshi’s valuation against sportsbook operators to assess whether current multiples are justified.
Kalshi Growth and Market Composition
Kalshi has seen rapid growth over the past year, with total monthly notional volume increasing 80x from $180M at the start of 2025 to $14.4B in March 2026. Monthly volumes have grown at an average rate of 40%, reflecting both increased participation and higher trading activity per user.
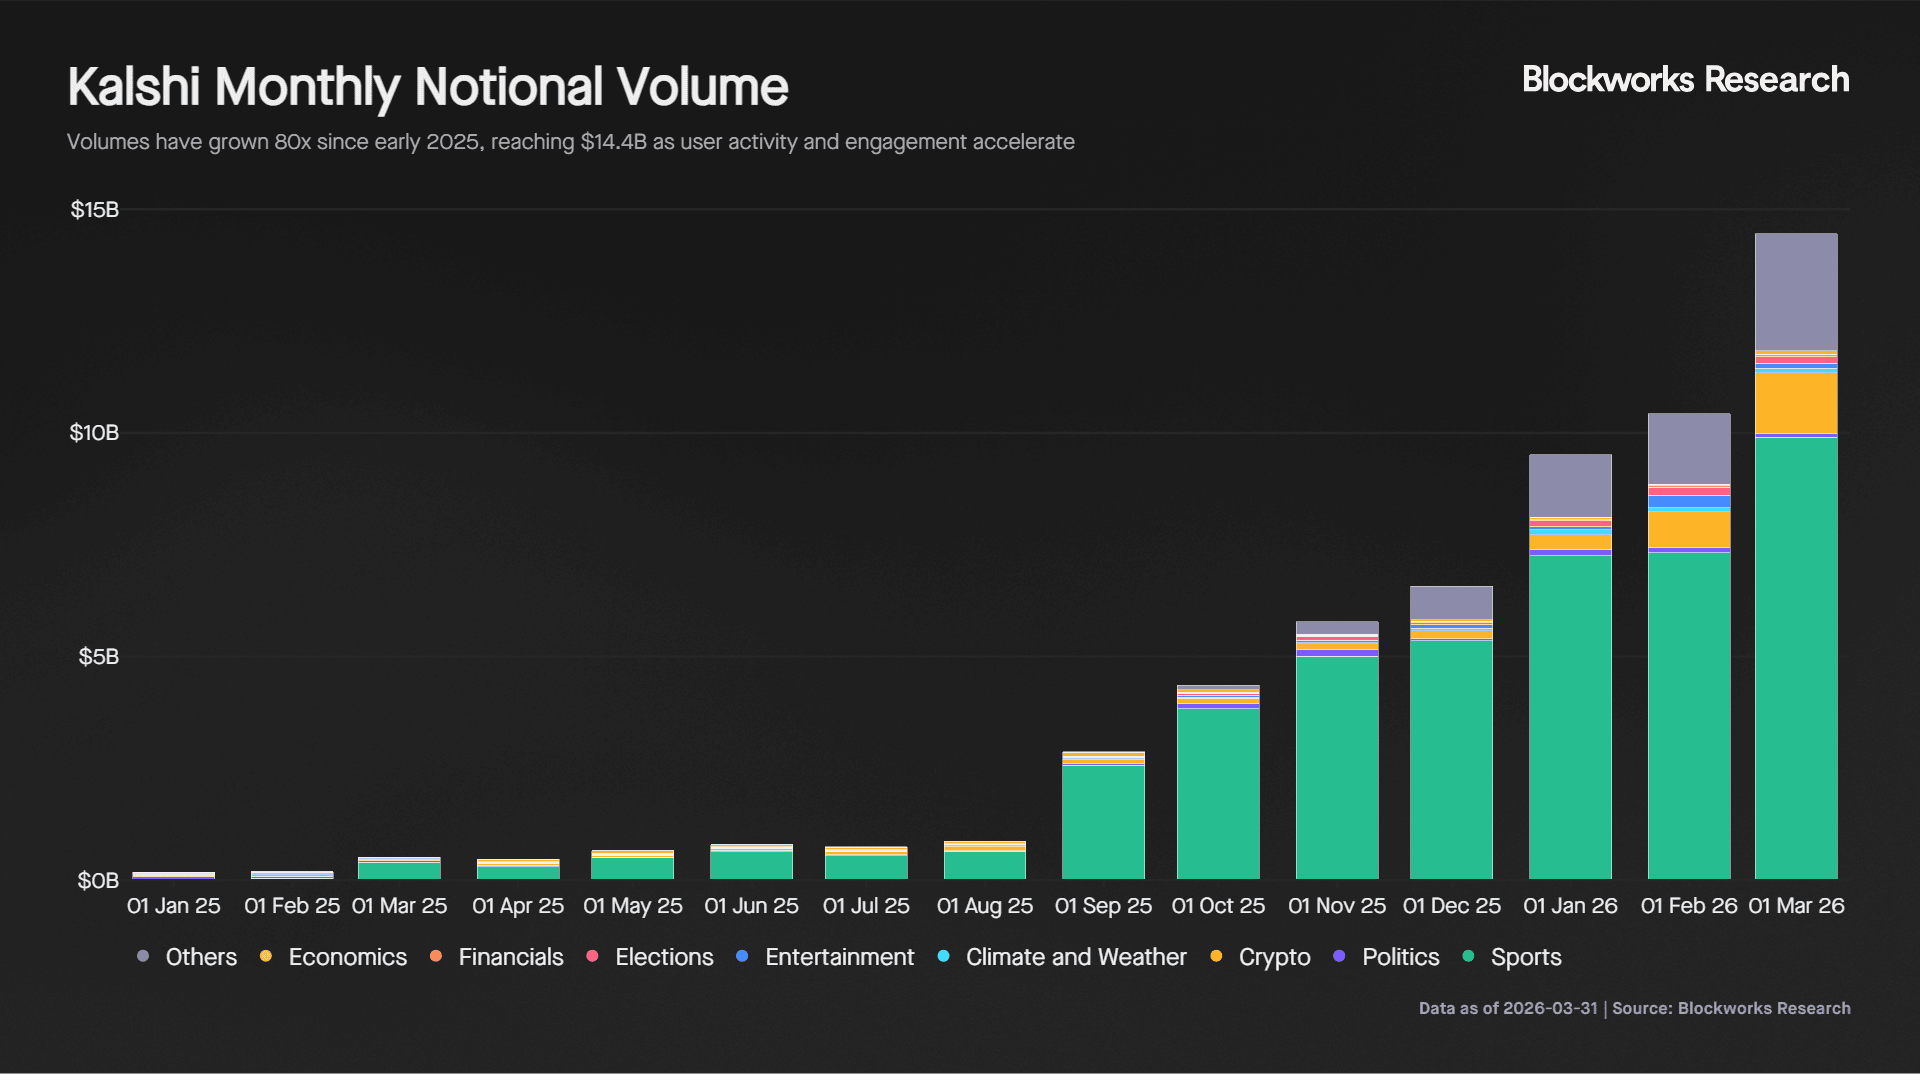
Sports markets have been the primary driver of this growth and currently account for 68% of total volume. Volumes in sports increased from $540M in July 2025 to $9.9B in March 2026, an 18x increase over three quarters. Kalshi has established a strong position in this segment, accounting for approximately 70% of prediction market volume in sports.
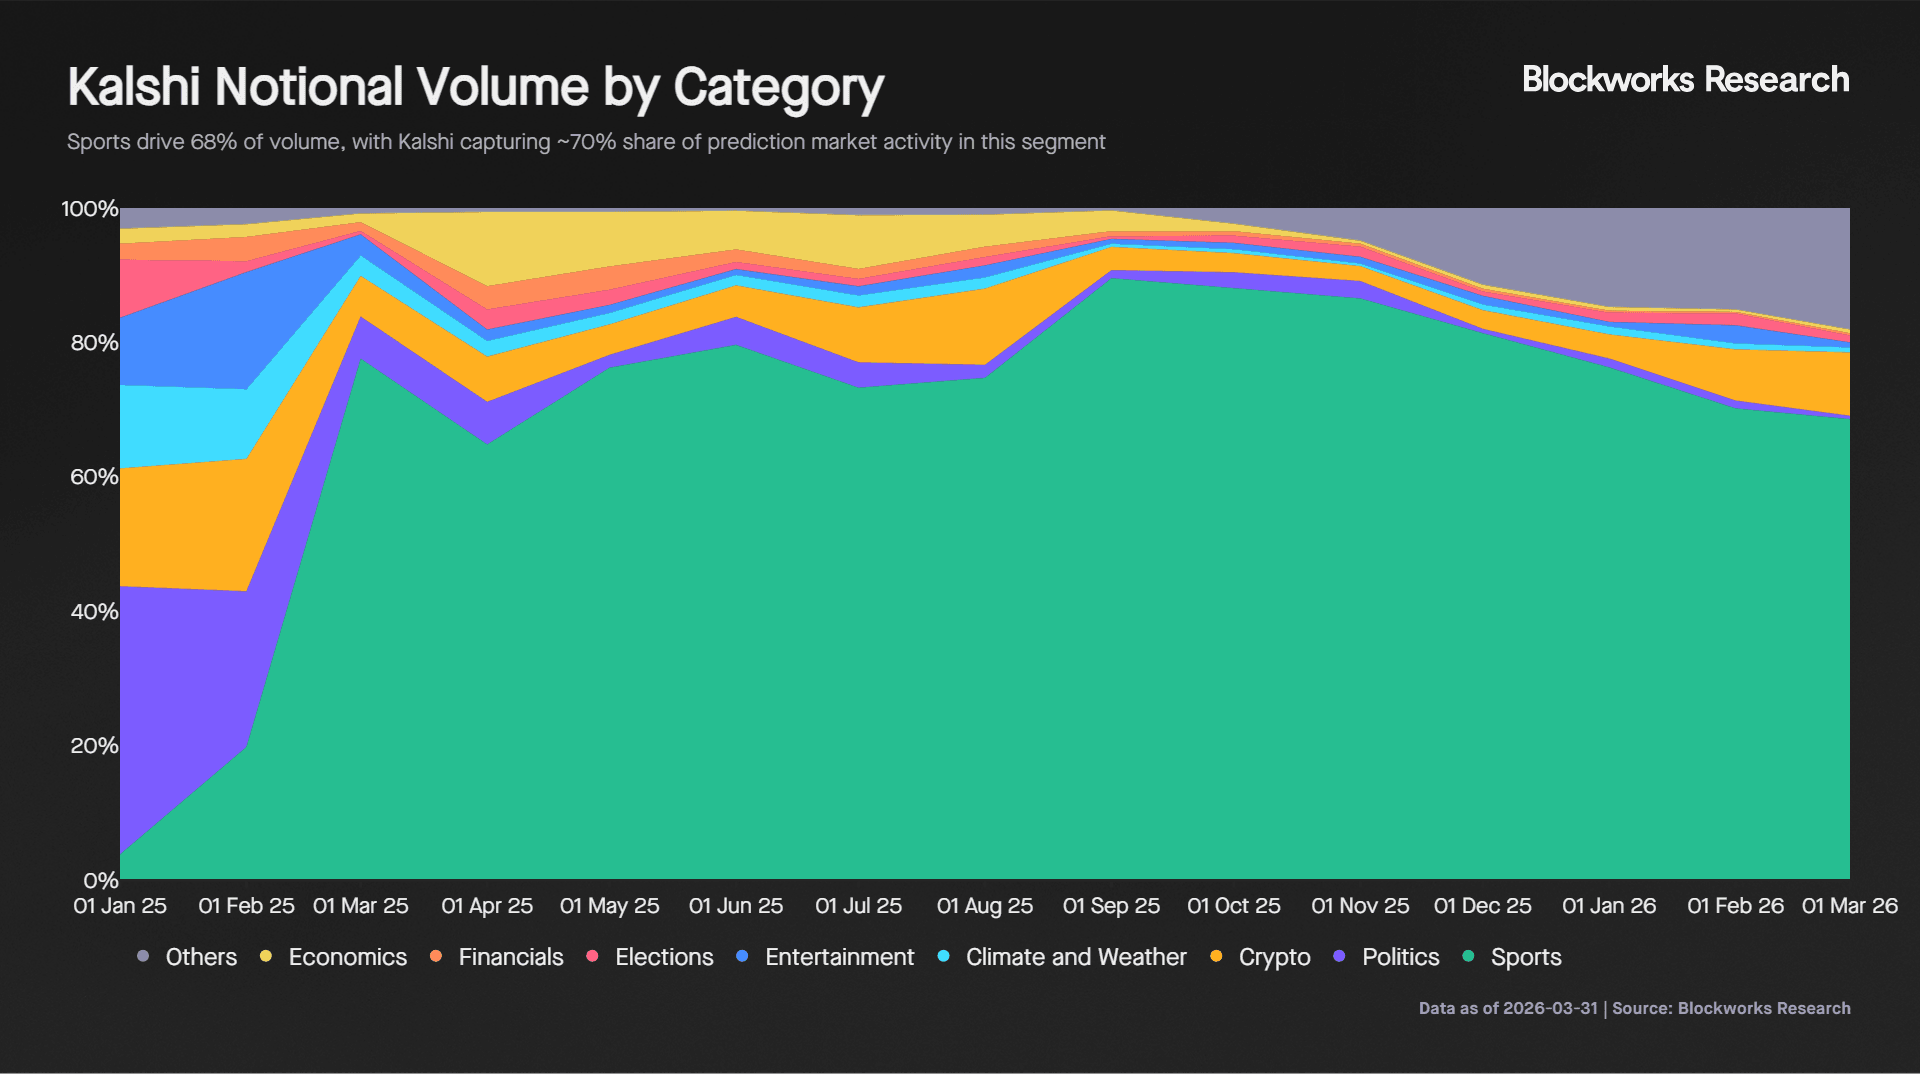
At the same time, volume composition has begun to diversify. The share of sports has declined from a peak of 90% in September 2025 as other categories such as crypto, entertainment, and elections have gained traction. This diversification reduces reliance on a single category and supports more stable long term growth.
Within sports, volume is highly seasonal and driven by major events. Basketball accounts for 44% of sports volume, followed by football at 28% and tennis at 10%. Football drove a sharp increase in volume between August and September 2025, rising from $640M to $2.6B, before declining after the Super Bowl.
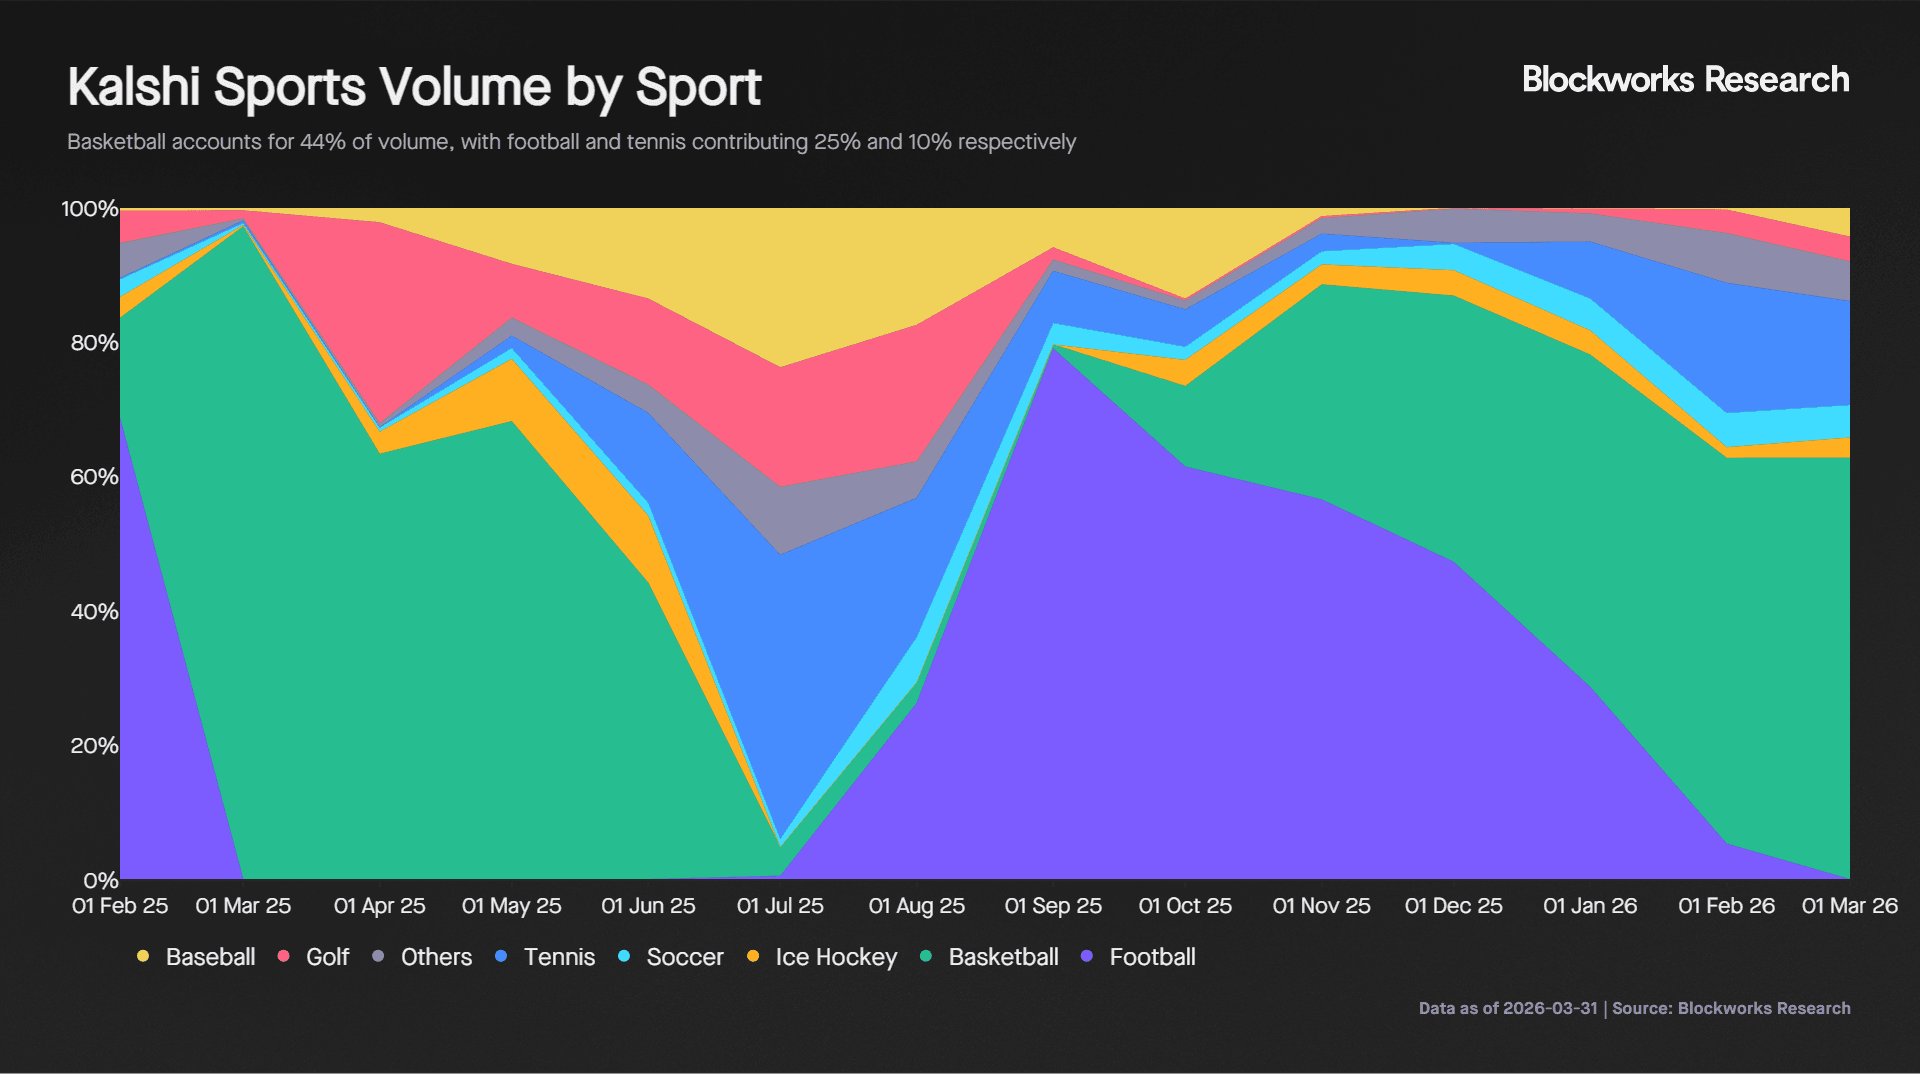
Since October, basketball has dominated volumes, with the recent NCAA men’s tournament generating $1.5B in raw volume and $3.3B in notional volume. This is comparable to the estimated $3.3B wagered by Americans on March Madness in 2026, highlighting the growing role of prediction markets as an alternative to traditional betting platforms.
Pricing Accuracy and Information Efficiency
Prediction markets aim to reflect true probabilities. To assess this, we compare implied probabilities two days before games with actual outcomes. In an efficient market, a team priced at 70% should win approximately 70% of the time.
We focus on Basketball and NFL markets, which together account for 72% of sports volume on Kalshi. The analysis is based on 3.1K games representing $8.5B in traded notional volume.
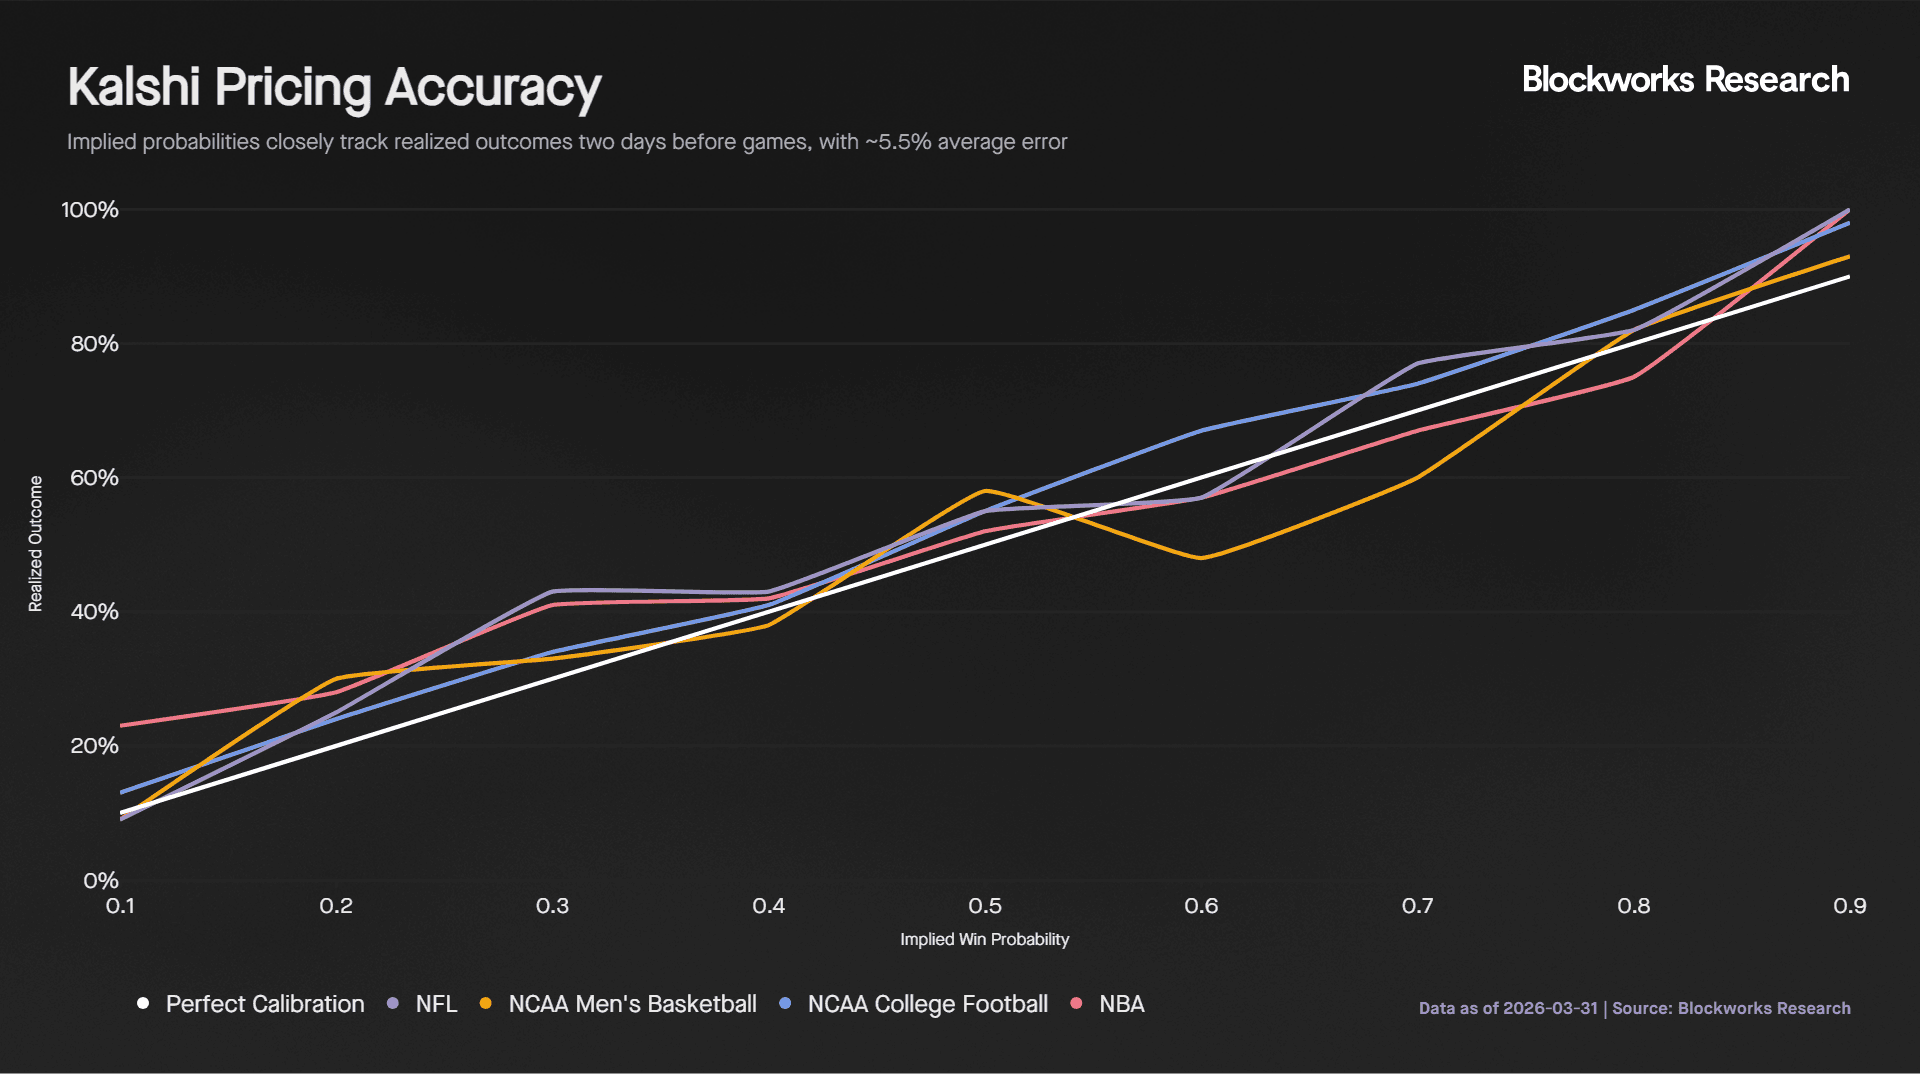
Two days before the start of a game, Kalshi prices are a strong predictor of outcomes. On average, implied probabilities deviate by 5.5 percentage points from realized results. NCAA College Football shows the highest accuracy among the four leagues analyzed.
This shows that odds leading into the start of the game are a strong indicator of the final outcome. It suggests that prices on Kalshi are not only reactive but incorporate meaningful information ahead of events. The accuracy likely reflects the presence of informed participants and model driven traders who actively price probabilities based on available data. As a result, market prices begin to converge toward true outcomes well before the game starts, reinforcing the role of prediction markets as an effective mechanism for information aggregation.
Liquidity, Volume Distribution and Market Maker Behaviour
It is important to analyze how volume is distributed across the lifecycle of a sporting market. Volume distribution provides insight into when meaningful information enters the market, how price discovery evolves, and which participants are driving moves. For traders, this highlights when markets are potentially mispriced versus efficient. For market makers, it informs spread setting, inventory risk, and the timing of aggressive versus passive quoting.
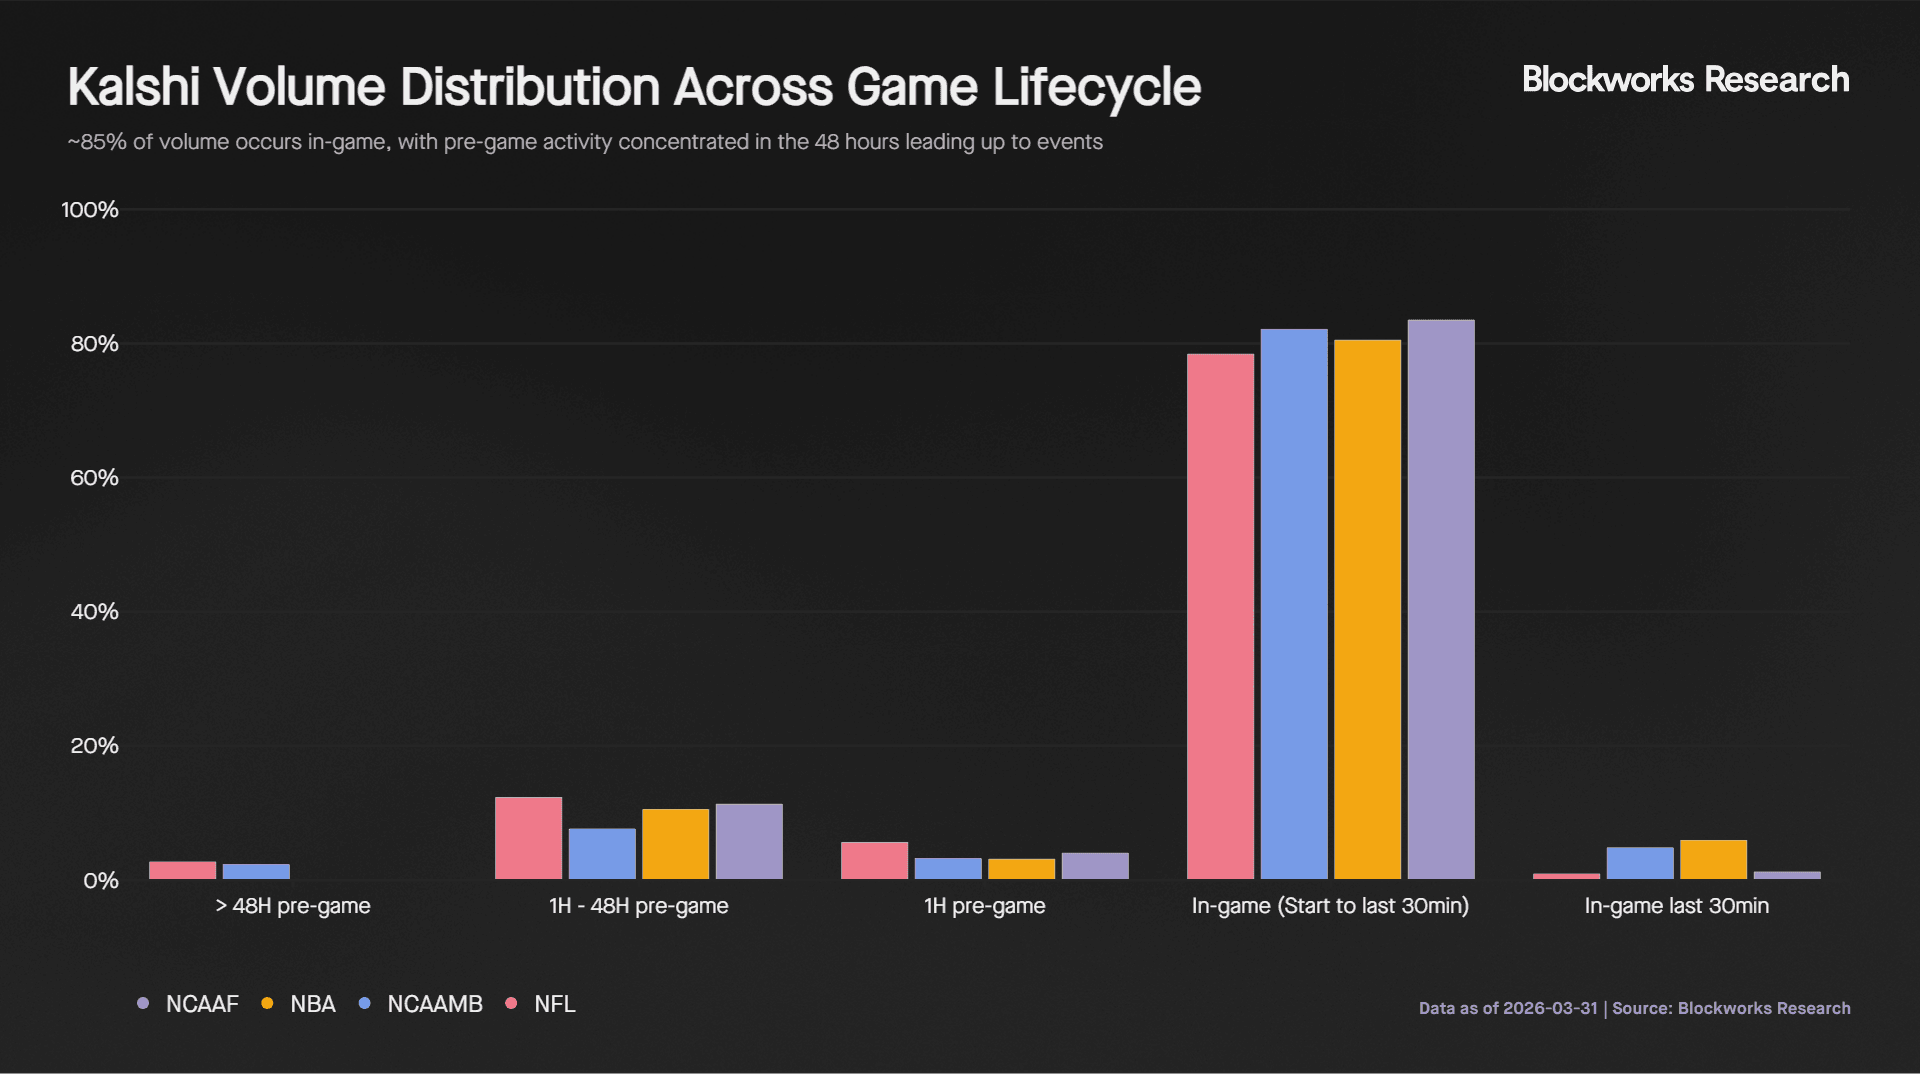
As expected, in-game trading accounts for approximately 85% of total volume, as real time events continuously update the probability of each team winning. Around 3% of volume occurs in the final 30 minutes, with almost none in the last 10 minutes as outcomes become largely determined. The absence of a late spike suggests that most participants hold positions to resolution rather than actively exiting.
Pre-game activity is concentrated in two windows. The 1 to 48 hour period accounts for 10.4% of volume, while the final hour before the game accounts for 4%. Prior to this, activity is minimal at just 1.3%. This indicates that markets transition from a low liquidity, low information environment into a more active price discovery phase roughly 48 hours before the game, where informed or model driven participants begin positioning. The spike in the final hour likely reflects the incorporation of last minute information such as lineups and news.
Given this distribution, we assess how market makers adjust quoting behavior. Depth data is available from March 25th onwards, so the analysis focuses on March Madness games, which saw elevated activity during this period.
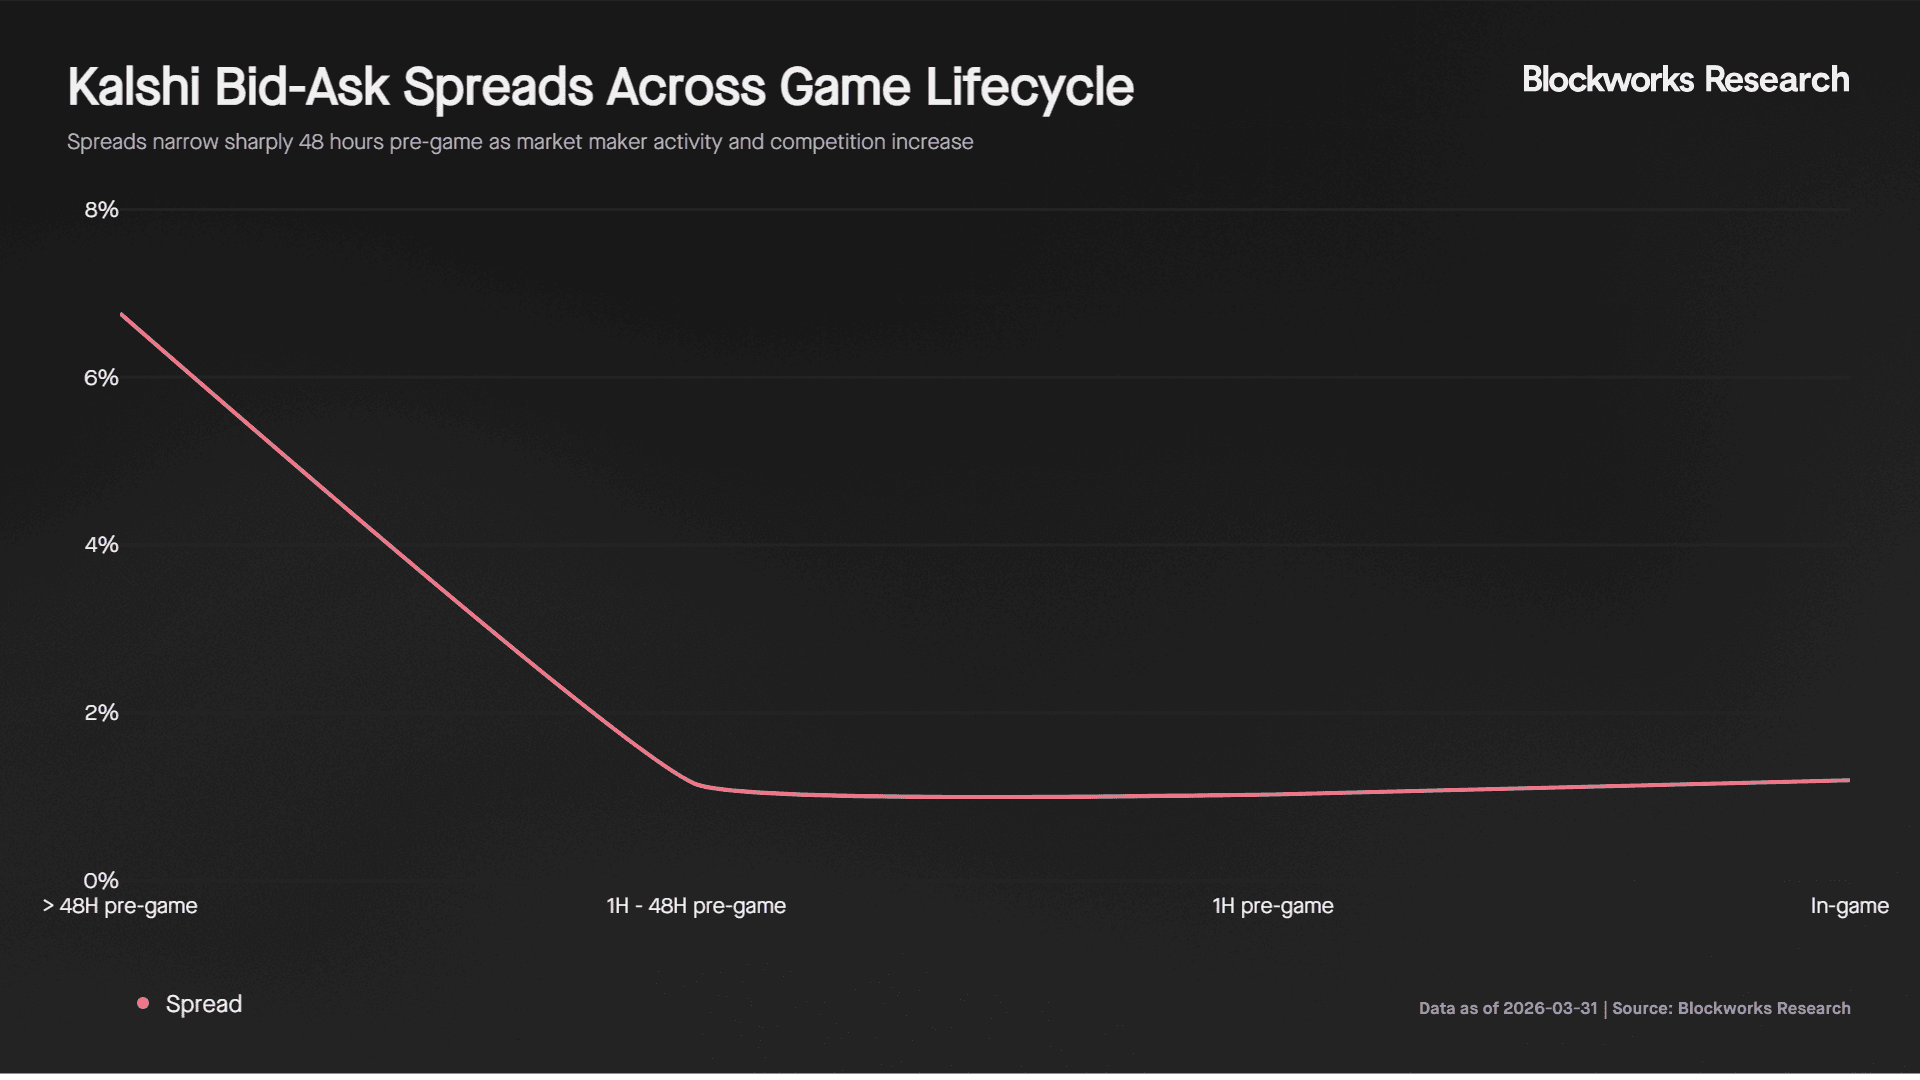
Spreads begin wide but tighten significantly to around 1.11% approximately 48 hours before the game and remain near the 1% floor through to completion. This aligns with the increase in volume and suggests that market makers become more active and competitive during this period.
Market depth, measured as contracts available at the best bid and ask, increases 19x alongside volume in the 48 hour pre-game window. However, in-game, depth declines by 76% despite higher trading activity. This indicates that market makers reduce displayed size while maintaining tight spreads, likely to manage adverse selection risk as probabilities update rapidly during live play.
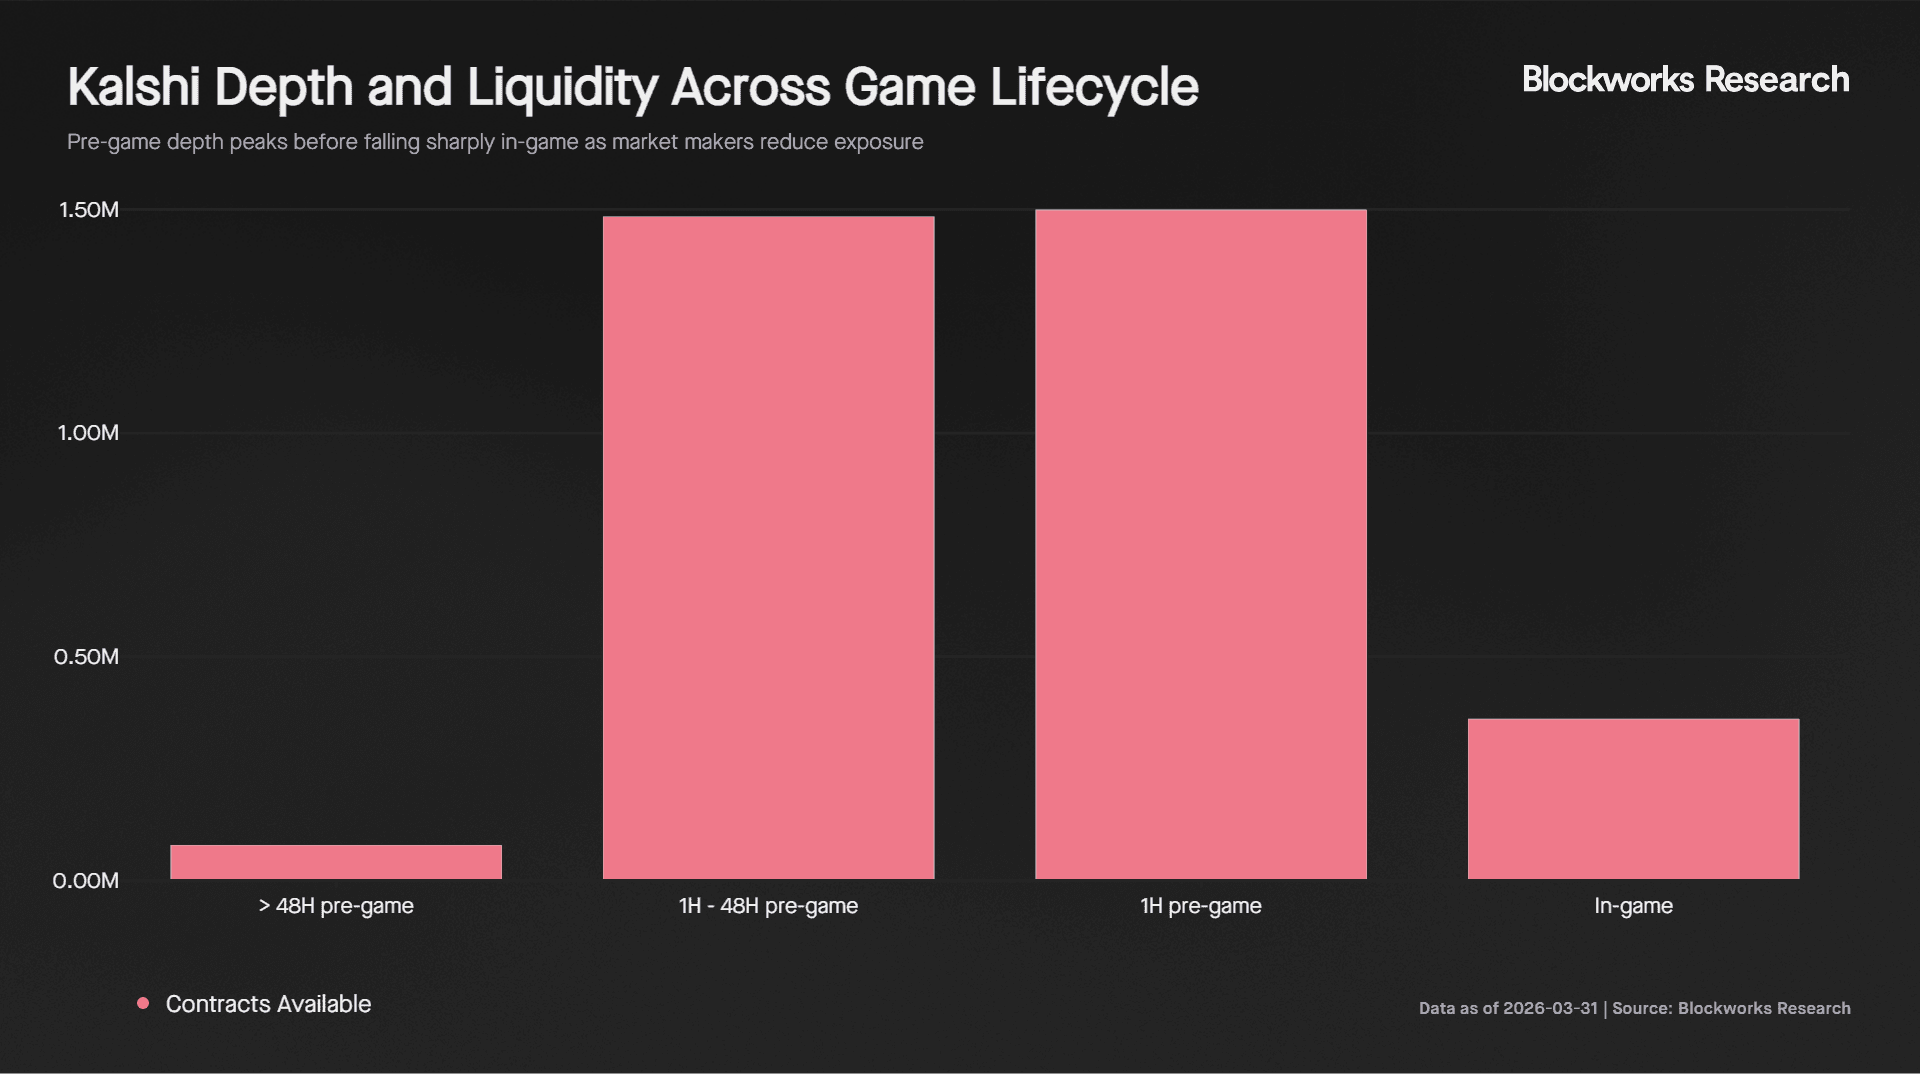
In-game depth averages 16.3K contracts per market, compared to a pre-game peak of 73K contracts. At typical prices near $0.50, this equates to roughly $4.1K of executable liquidity per side at the touch. This is sufficient for smaller retail trades, but becomes a constraint for larger institutional orders.
For institutional participants deploying $5K or more per position, in-game execution is limited, as orders either move the price or must be split across multiple markets. As a result, the optimal execution window for size is the 48 hour to 1 hour pre-game period, where depth is over 4x higher and spreads remain equally tight.
Comparison to Sportsbooks and Arbitrage Dynamics
Prediction market prices must reflect live game conditions accurately to attract sophisticated traders and institutional capital. To assess this, we compare real time odds on Kalshi with FanDuel across two high volume games.
Michigan vs Arizona, NCAA Championship
In the 72 hours before tip off, Kalshi and FanDuel tracked closely, with Arizona’s implied win probability around 48% on both platforms. Approximately 18 hours before the game, FanDuel moved Arizona closer to 50%, with Kalshi following around 7 hours later. The average pre-game difference was 0.54%, indicating strong alignment during the pre-game period.
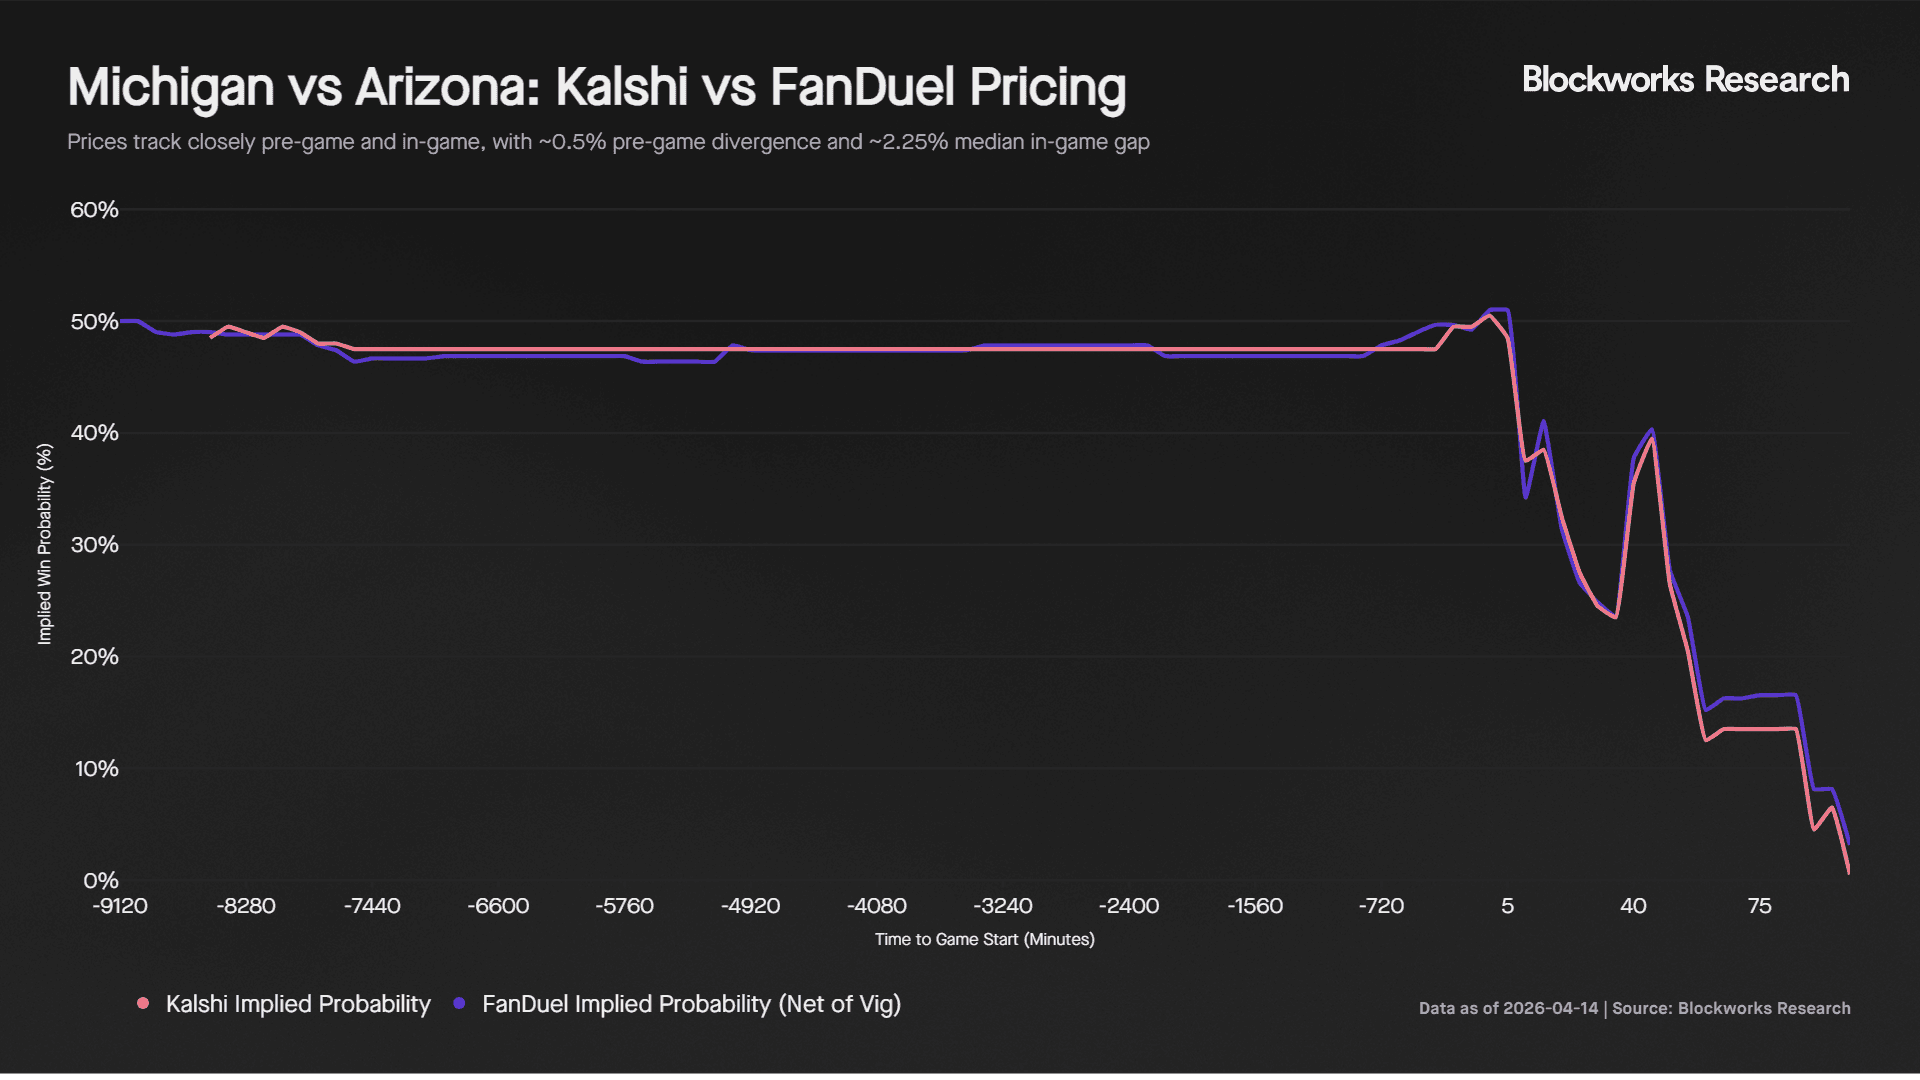
Once the game began, prices moved in near lockstep, with a correlation of 0.9962. This indicates no meaningful lead or lag between platforms at a 5 minute resolution. However, a persistent pricing gap emerged, with a median in-game difference of 2.25%.
This gap is largely explained by structural differences. FanDuel includes a built in margin, or vig, of approximately 4.5%, equivalent to around 2.25% per side. On Kalshi, contracts trade in 1% increments, with a minimum spread of 1%. For a taker crossing the spread on one leg of an arbitrage, the effective cost is approximately 0.5%, bringing total trading friction to roughly 2.75%. As a result, traders must overcome these combined costs before any arbitrage opportunity becomes profitable.
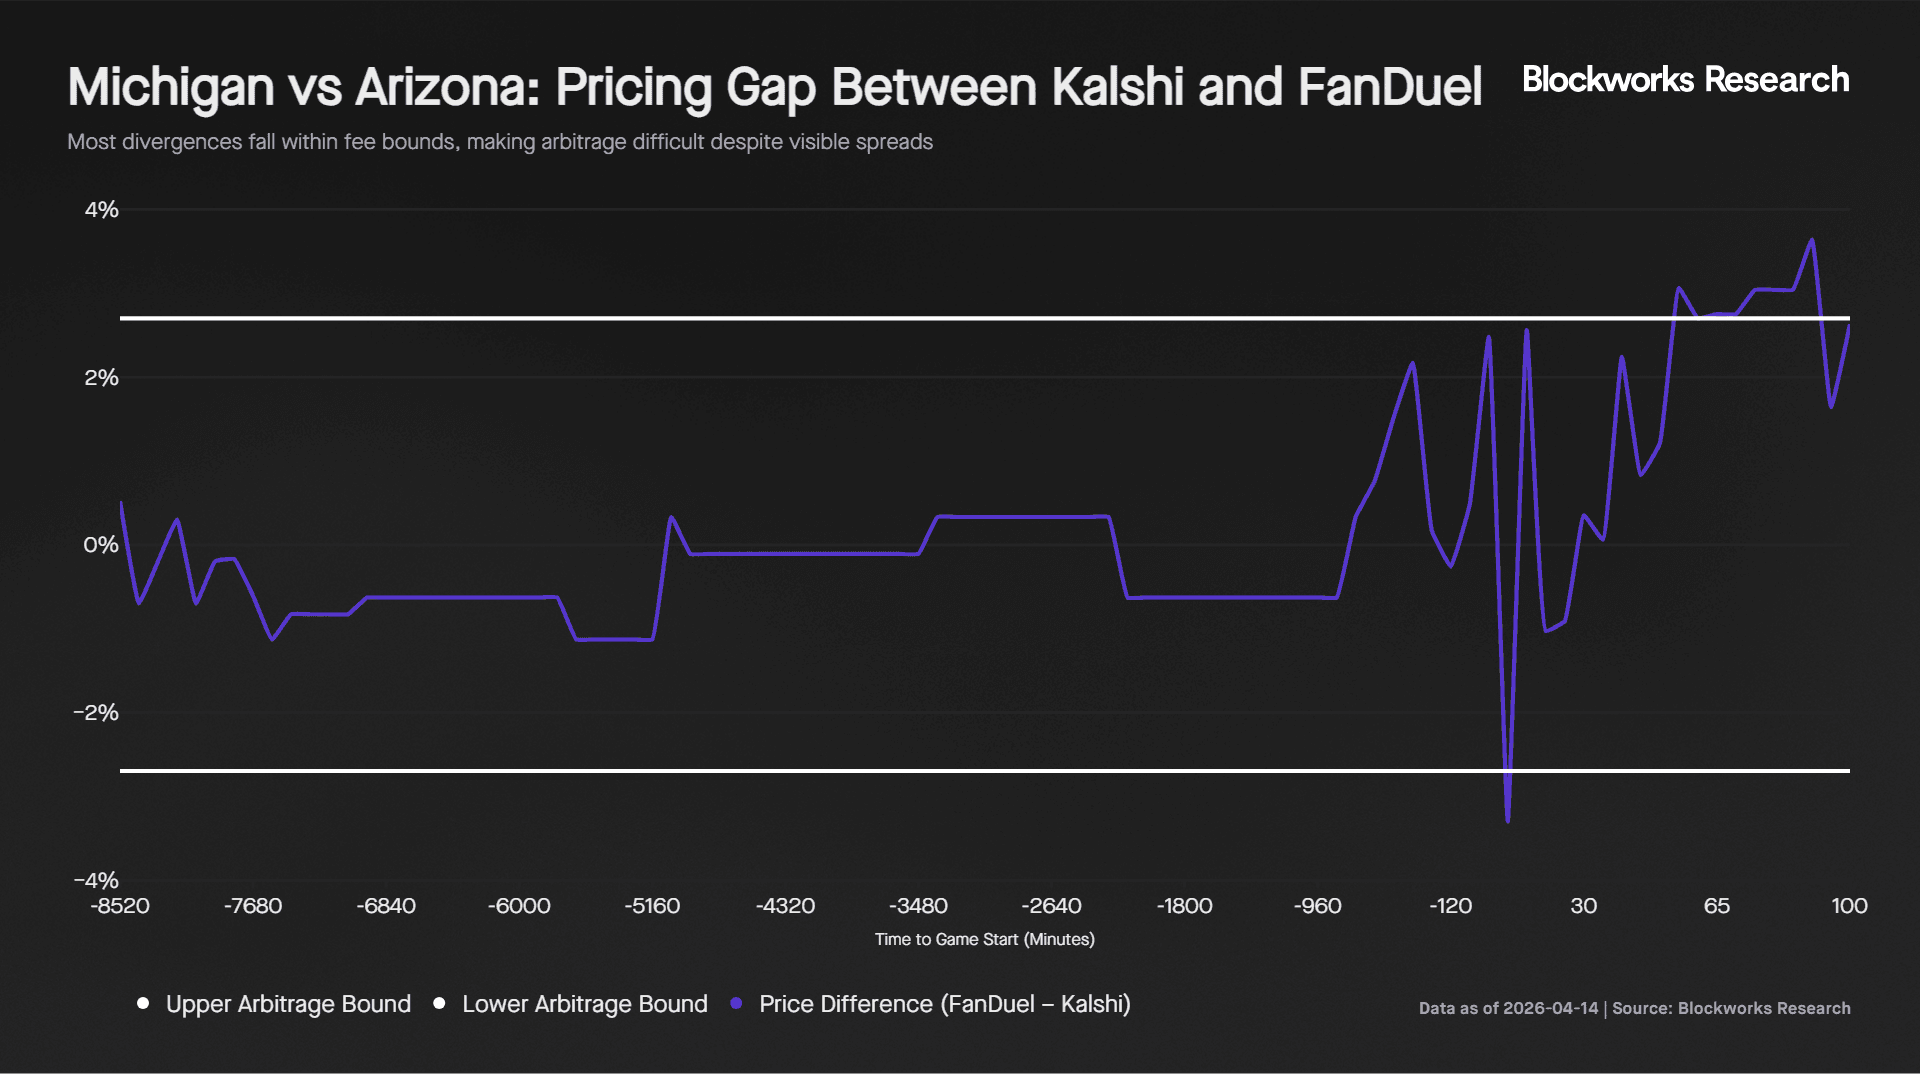
In practice, price differences were only marginally sufficient to overcome these costs. The median in-game gap was 2.59%, and 8 out of 20 five minute intervals (40%) exceeded the cost threshold. While the gap reached a maximum of 3.64% in the second half as FanDuel was slower to reprice Michigan’s growing lead, these opportunities were not persistent enough to support a reliable arbitrage strategy. This is further constrained by thin in-game liquidity on Kalshi, which limits the ability to execute meaningful size.
Importantly, the gap was directional in the second half, with FanDuel consistently pricing Arizona higher than Kalshi as Michigan extended its lead. This suggests Kalshi incorporated in-game information more quickly during momentum driven periods.
Buffalo Bills vs Denver Broncos, NFL Playoffs
Pre-game pricing showed less immediate convergence. Five days before kickoff, the platforms disagreed by 5.7%, with FanDuel pricing Buffalo at 53.7% and Kalshi at 48%. Both platforms adjusted gradually over the week, with neither consistently leading. By kickoff, both converged near 48% for Buffalo. The mean pre-game difference was 1.40%, more than double the NCAAB example, indicating weaker early consensus.
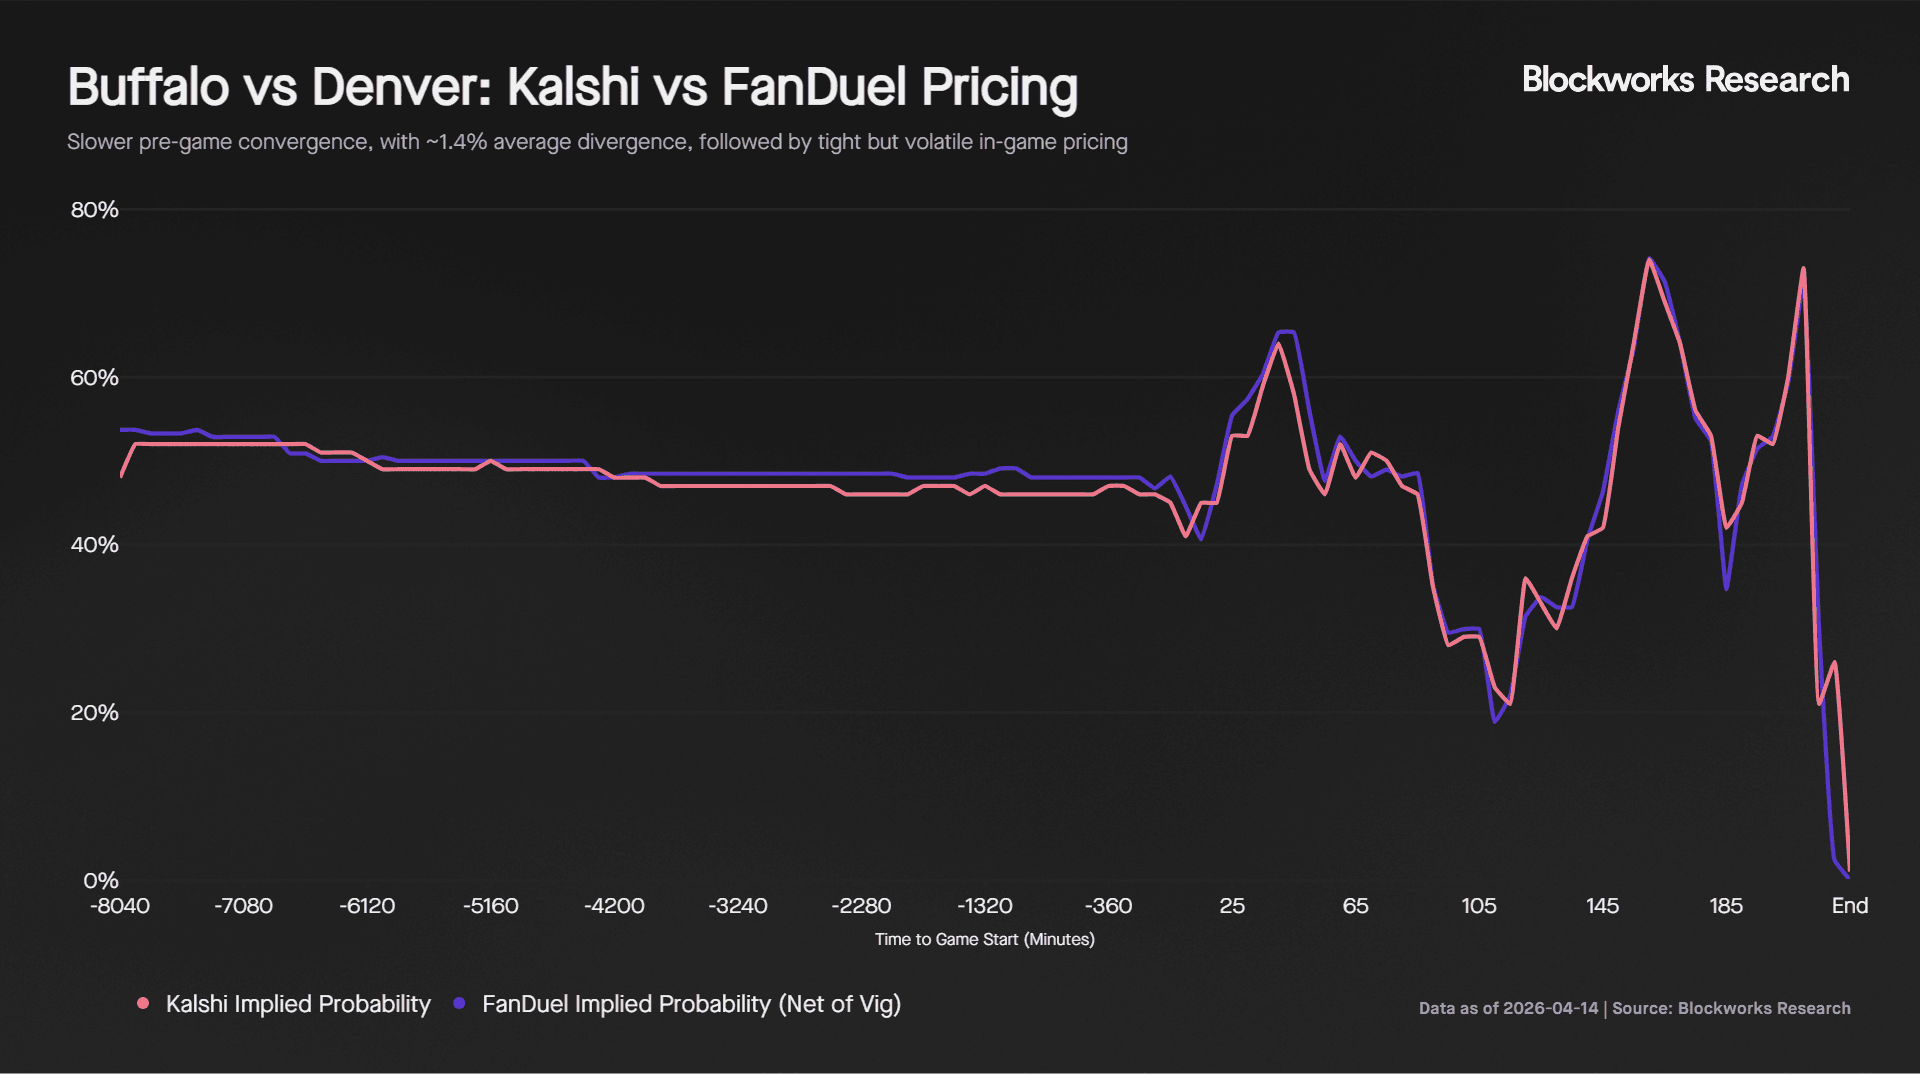
Once the game began, prices again moved closely, with a correlation of 0.9738. The game was highly volatile, with multiple lead changes and large swings in win probability, including Buffalo reaching 74% late in overtime before Denver ultimately won.
The median in-game gap was 1.61%, with a mean of 2.40%. Unlike the NCAAB example, the gap had no consistent direction, with both platforms alternating between leading and lagging throughout.
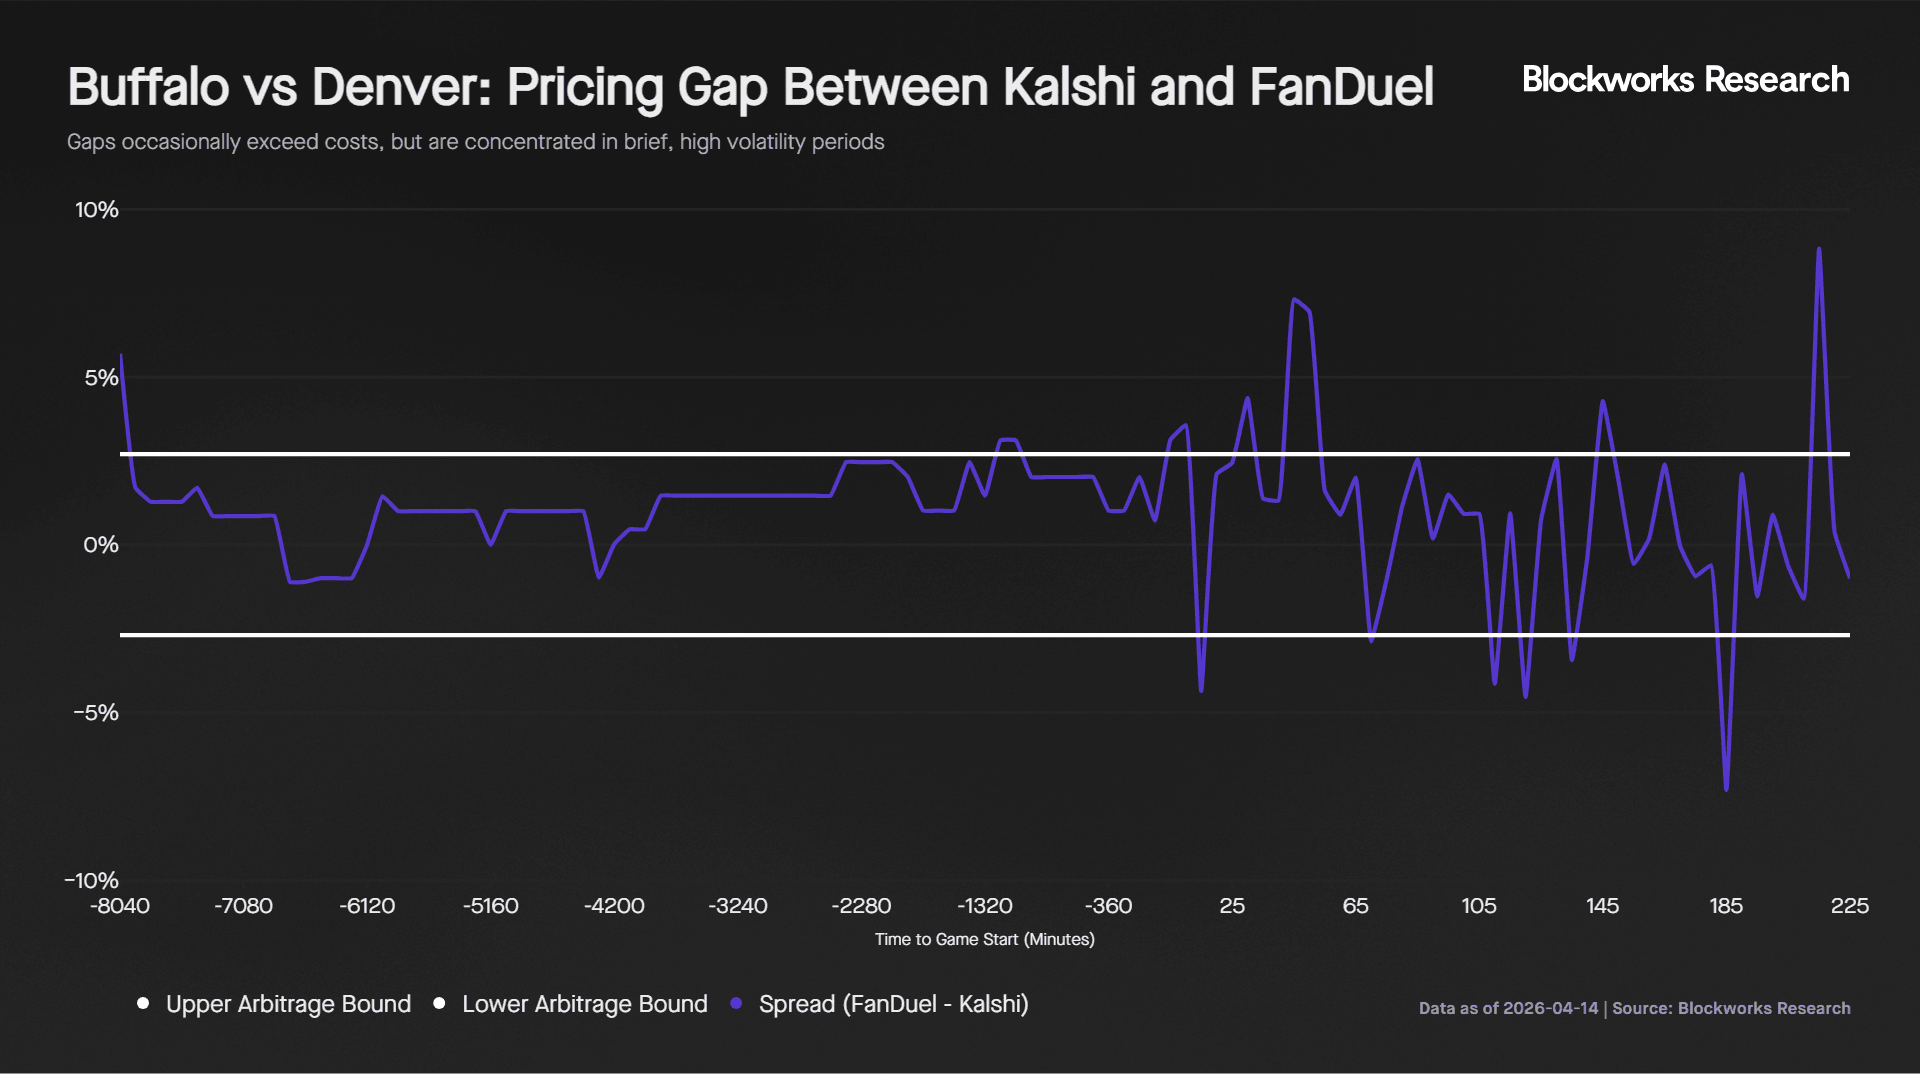
Against the 2.75% cost threshold, 13 out of 45 five minute intervals (29%) showed a gap wide enough to trade. These opportunities were concentrated during sharp momentum swings, with the gap reaching as high as 8.8%, but were short lived rather than persistent. As with the NCAAB example, thin in-game liquidity on Kalshi limits the ability to execute meaningful size, reducing the practical viability of arbitrage.
What This Means For Market Participants
Odds on Kalshi track traditional sportsbooks closely, with both platforms incorporating game information in near real time. Alignment is strong both pre-game and in-game, although small and persistent differences remain. This highlights the strength of Kalshi’s markets in aggregating information and producing accurate probability estimates.
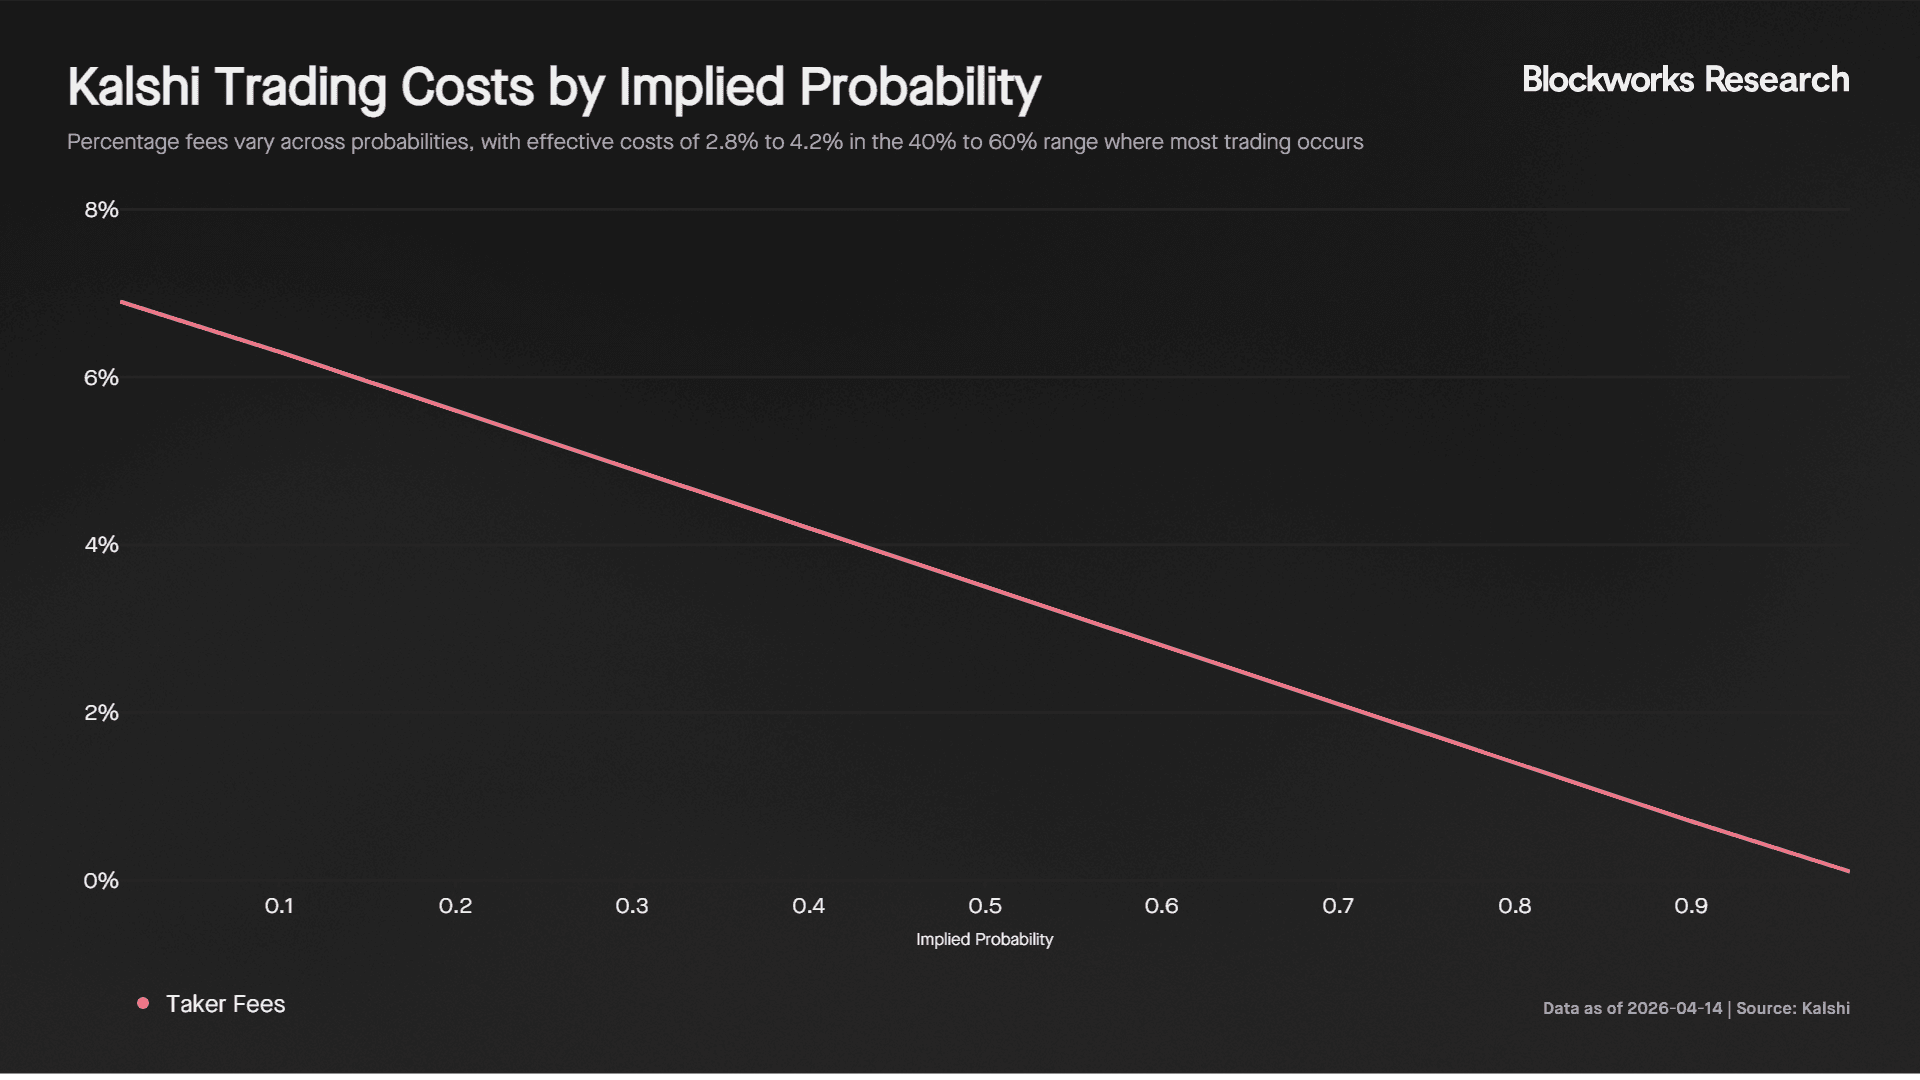
FanDuel odds are shown net of the vig, which acts as an entry cost of approximately 2% per side. On Kalshi, fees vary with contract probability and are highest in absolute terms around the 50% level, reaching approximately 3.50% for takers and 0.88% for makers on markets where maker fees apply. As most in-game trading occurs in the 40% to 60% probability range, effective trading costs on Kalshi fall between 2.8% and 4.2%, making them comparable to or, in some cases, higher than traditional sportsbooks, particularly for takers.
These higher costs, combined with thinner in-game liquidity, mean that larger and more sophisticated bettors may continue to prefer traditional sportsbooks, where pricing can often be negotiated and execution of size is more efficient. For Kalshi to compete more effectively, lower fees and stronger incentives for liquidity provision will be important, particularly in-game where depth declines despite higher trading activity.
However, these constraints are likely to improve over time. Increasing competition from platforms such as Polymarket should drive changes in fee structures and liquidity incentives. On sports markets, Polymarket operates with a lower taker fee of 0.03 compared to 0.07 on Kalshi, while offering zero fees for makers and a 25% fee rebate. In addition, it has announced a $5M sports liquidity incentive program for April 2026 aimed at encouraging tighter quoting and deeper order books.
While Kalshi also offers liquidity incentive programs that reward size and proximity to the spread, its base fee structure remains higher. As competition between platforms intensifies, this should drive fee compression and improved liquidity conditions across the market.
This, in turn, creates a reinforcing flywheel. Improved liquidity attracts more traders, higher trading volumes draw in additional market makers, and increased market making activity further deepens liquidity and improves execution quality.
Over time, as depth improves and execution becomes more efficient, we expect increased participation from more sophisticated capital, including sports focused hedge funds and reinsurance-style participants. Early signs of this trend are emerging, with Kalshi expanding into the reinsurance market through partnerships such as its deal with Game Point Capital.
Beyond trading, probabilities on Kalshi are also beginning to take on informational value. In sporting markets, this could extend to clubs, agents, or reinsurers using market-implied probabilities to hedge contractual exposures, such as performance-based payouts tied to player or team achievements.
Kalshi’s Structural Edge
Despite similar pricing dynamics and, at times, higher trading costs, Kalshi has scaled rapidly due to several structural advantages over traditional sportsbooks.
First, prediction markets operate on a peer to peer basis, where traders transact against one another rather than against a house with a built in edge. This structure has enabled Kalshi to be regulated as a designated contract market under the CFTC, allowing it to operate across all 50 states. In contrast, major US sportsbooks such as DraftKings and FanDuel are only available in a subset of states, while leading global platforms such as Pinnacle and Betfair remain inaccessible in the US, giving Kalshi a broader addressable market.
Second, traditional sportsbooks actively limit successful users through stake restrictions, reducing the ability of consistently profitable bettors to deploy capital at scale. These limits are often applied dynamically, with profitable users facing reduced bet sizes or account restrictions. This creates a structural ceiling on returns. Kalshi does not impose such constraints and instead benefits from the participation of more sophisticated traders, who contribute to price accuracy and overall market efficiency.
Third, Kalshi’s interface presents outcomes directly as probabilities rather than odds, making pricing more intuitive and easier to interpret. This aligns more closely with how institutional participants assess expected value and risk. In addition, Kalshi allows continuous trading, enabling users to enter and exit positions dynamically throughout the lifecycle of a game. While sportsbooks may offer cash out features, these are not universally available and are often restricted during key moments.
That said, liquidity on Kalshi is not uniform throughout the game. Based on discussions with market makers, depth can thin during pivotal moments such as shots or key plays, with some liquidity providers temporarily pulling quotes while awaiting resolution. However, users can still exit positions during these periods, though execution may come with some slippage.
Assessing Kalshi’s Valuation
With the above in mind, the key question is how Kalshi’s valuation compares to traditional sportsbook operators.
Using Kalshi’s taker fee formula of 0.07 × number of shares × share price × (1 − share price), we estimate revenue generation across its markets. This excludes certain fee free markets, maker fee variations, and other revenue streams such as deposits and withdrawals. It also does not account for volumes routed through partners such as Robinhood, which are subject to revenue sharing.
Based on this, Kalshi generated approximately $263M in revenue last year and is on track to generate $1.3B in 2026, with revenues growing at an average rate of 24% month on month. Approximately 80% to 90% of revenues are driven by sports markets. At a $22B valuation from its last funding round, this implies a forward 2026 price to sales multiple of 16.9x.
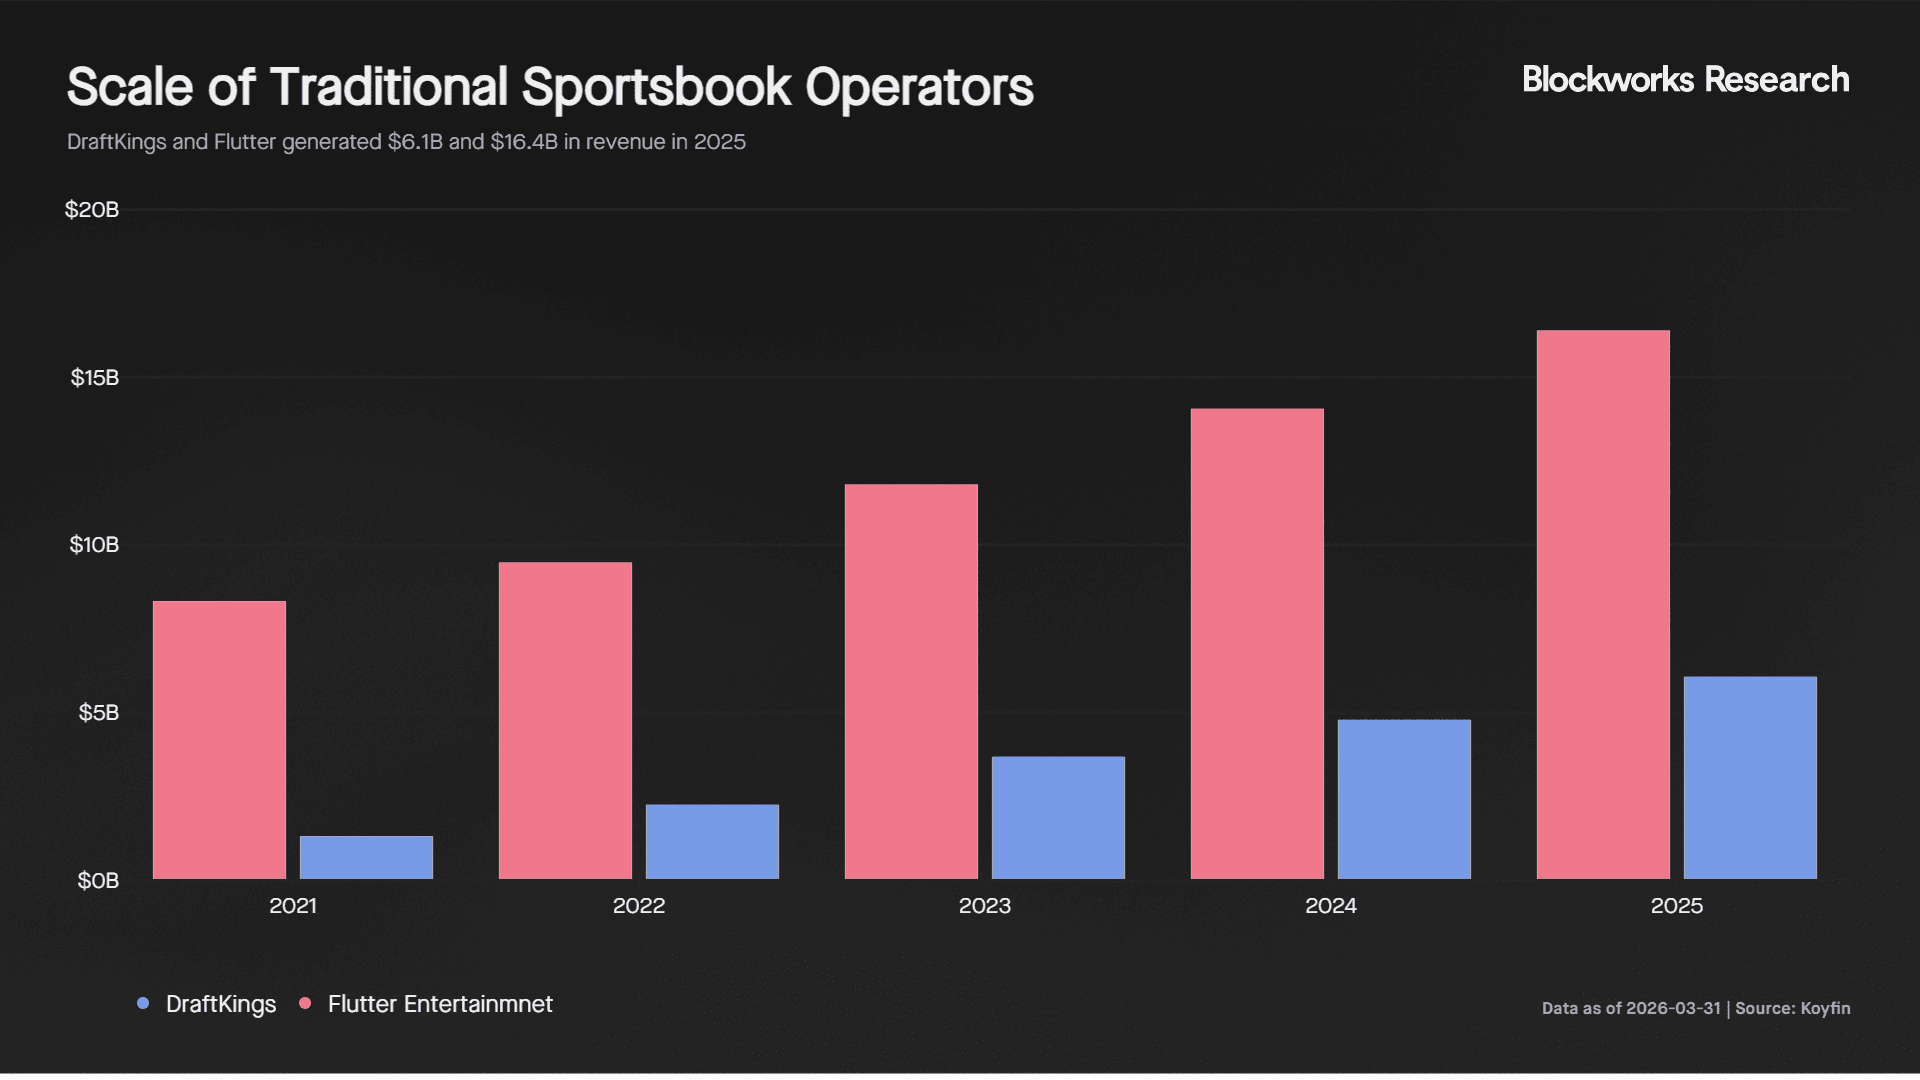
In comparison, traditional sportsbook operators such as DraftKings (DKNG) and Flutter Entertainment (FLUT) generate significantly higher absolute revenues, at $6.1B and $16.4B respectively in 2025.
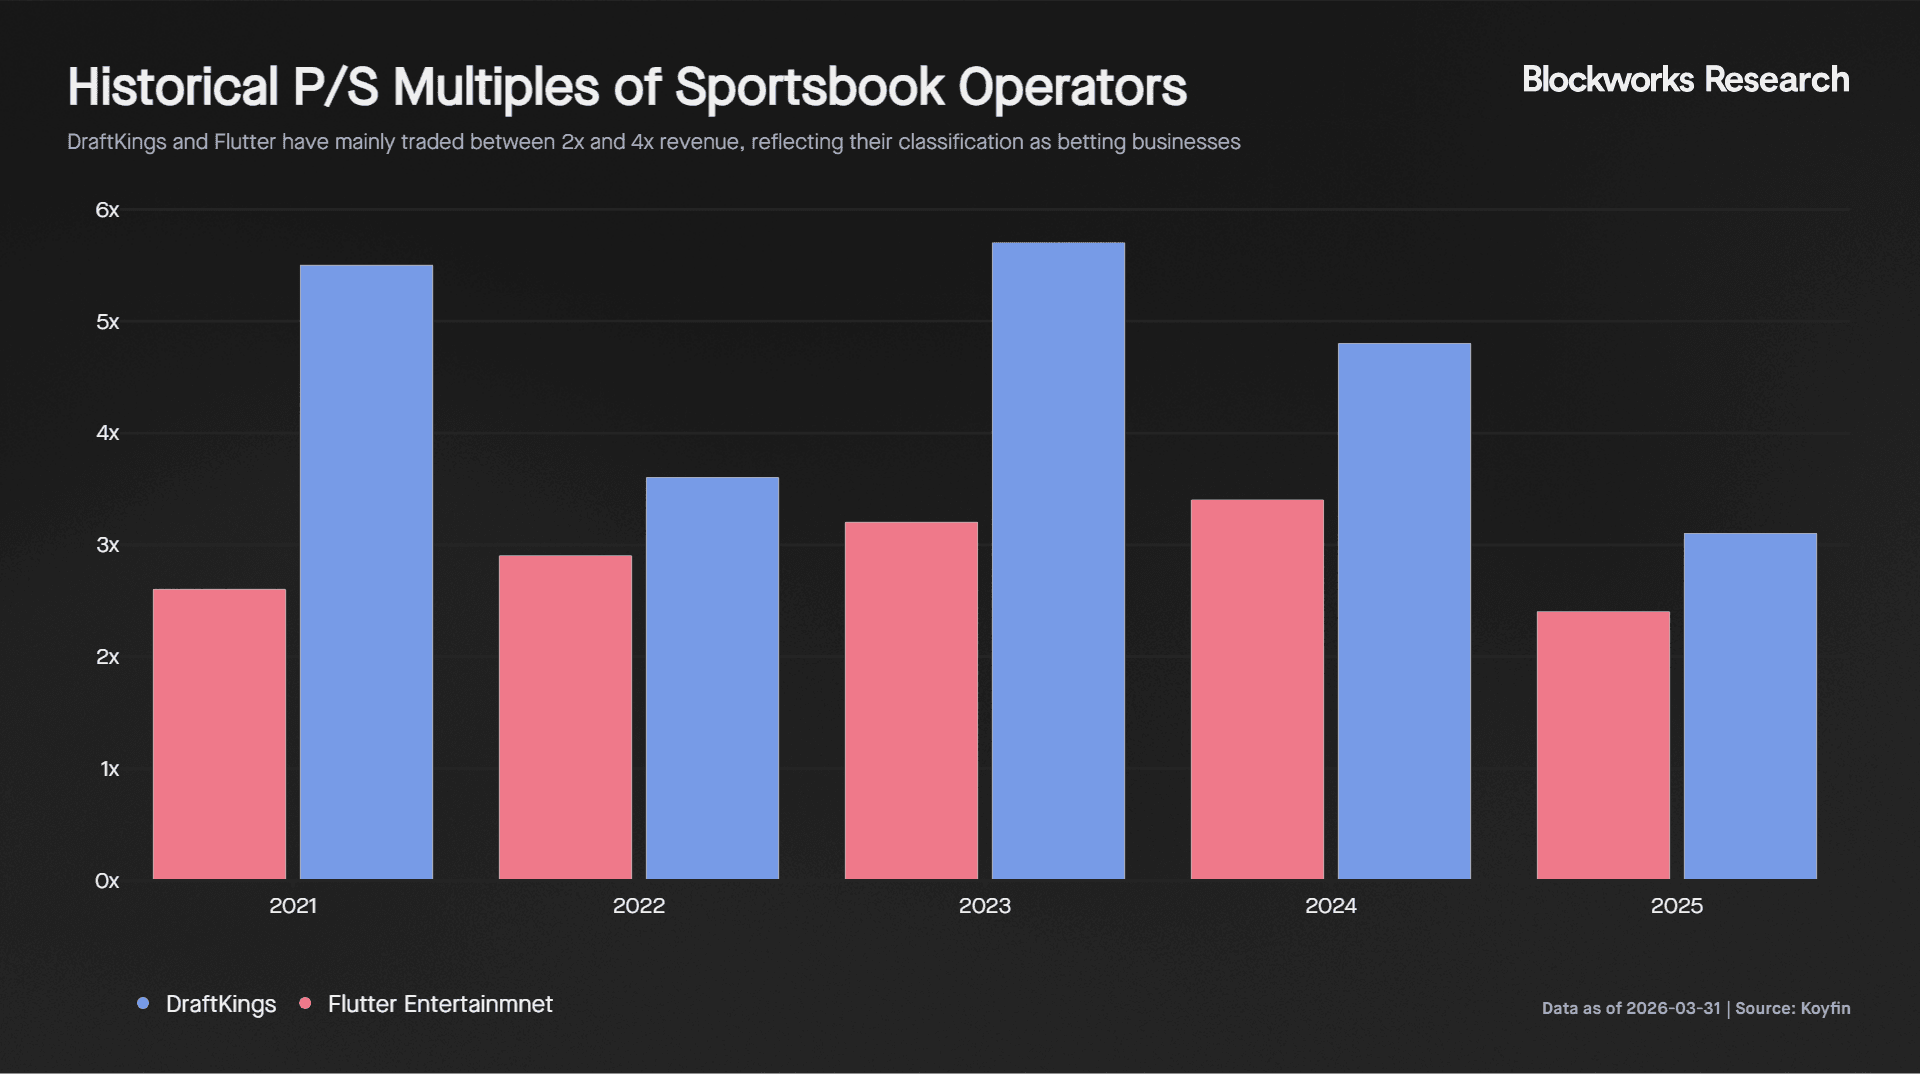
Despite this, they trade at market capitalizations of $11.0B and $17.9B, implying materially lower valuation multiples. Historically, these companies have traded at 2x to 4x revenue, reflecting their positioning as betting businesses.
The gap in valuation reflects differences in how the market is positioning Kalshi. While the underlying use case is similar, taking a view on event outcomes, Kalshi is being valued closer to an exchange than a sportsbook. This is driven by its peer to peer structure, regulatory positioning under the CFTC, and its ability to expand beyond sports into categories such as crypto, macro, and political markets. These factors imply a larger addressable market and higher long term growth potential.
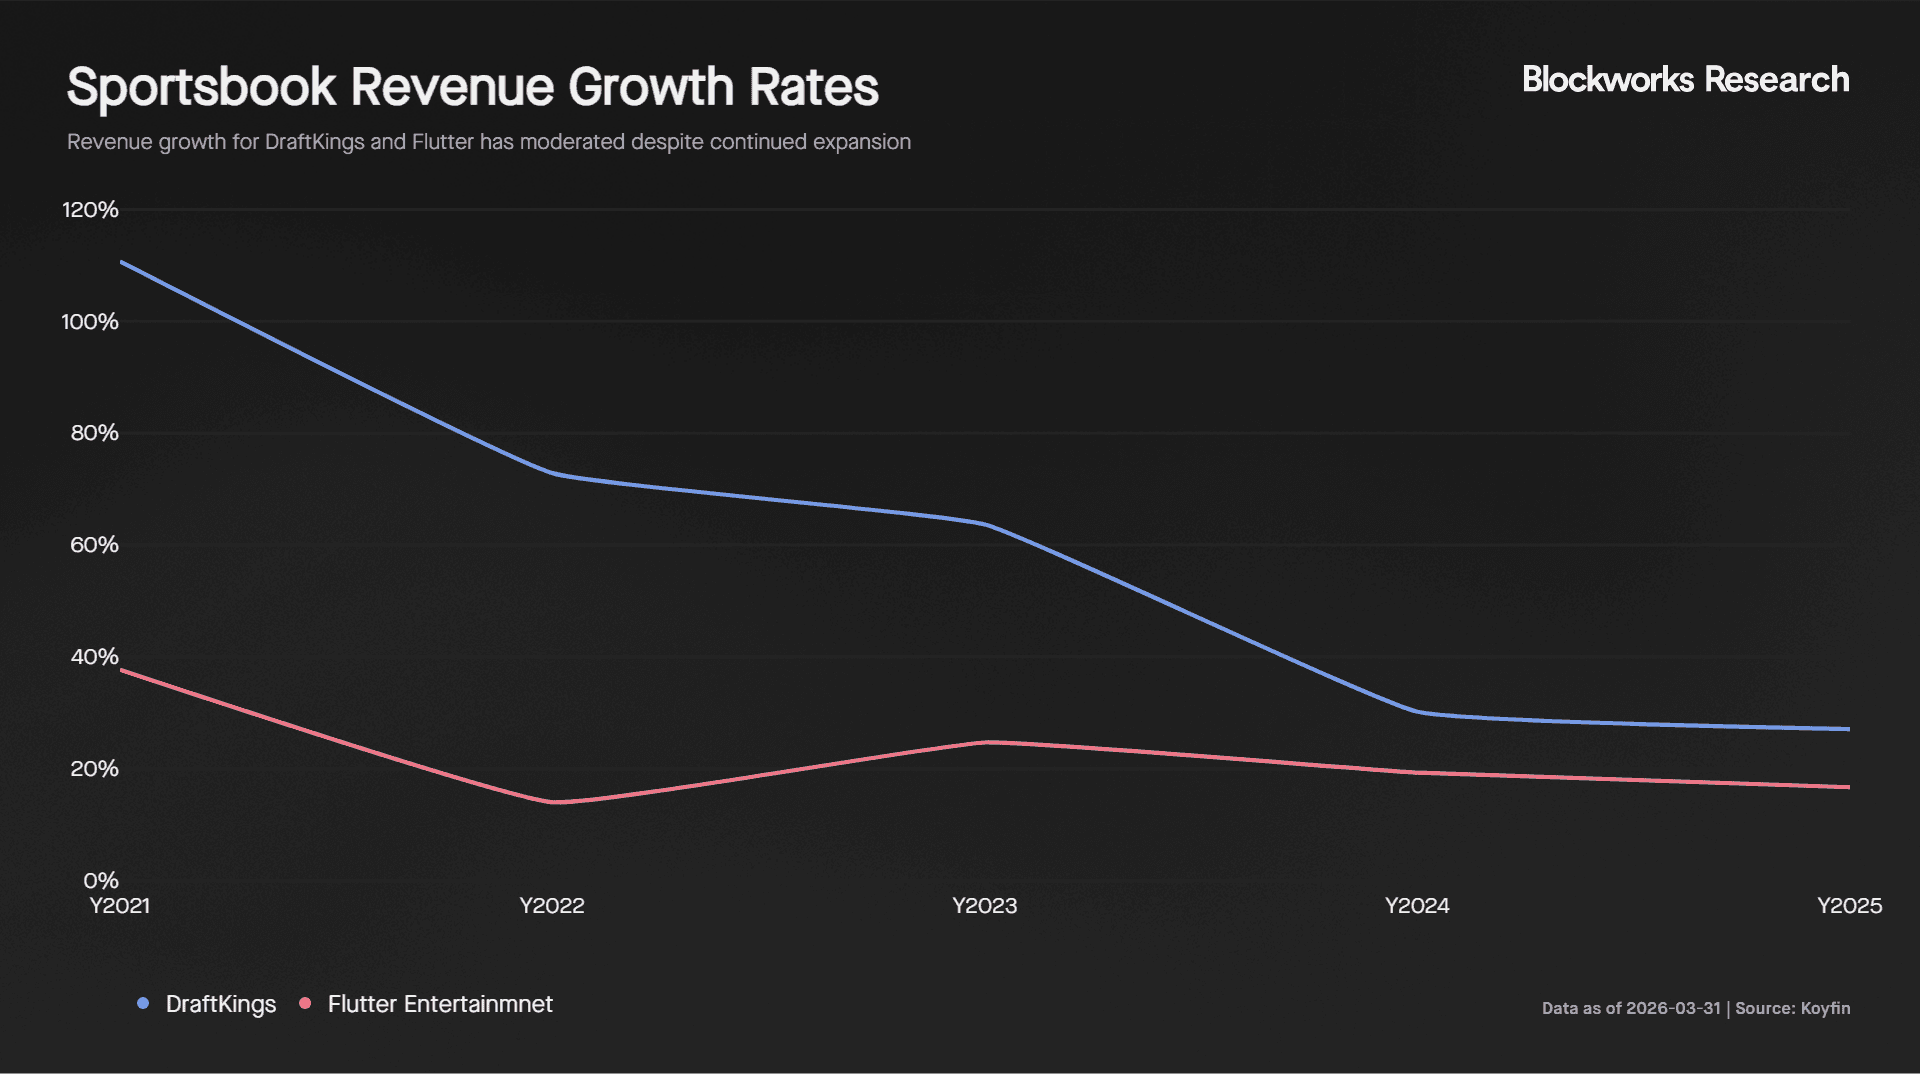
Kalshi’s growth profile further supports this premium. While revenues for DraftKings and Flutter continue to grow, their growth rates have slowed materially in recent years. In contrast, Kalshi is growing at a pace where monthly growth exceeds the annual growth rates of these traditional operators.
Valuation dispersion across the sector also reflects broader market dynamics. Betting companies tend to trade at lower multiples due to regulatory risk, taxation, and margin pressure. In contrast, exchanges such as Coinbase and Robinhood trade at higher multiples, suggesting that investors are assigning Kalshi a similar classification.
This positioning is consistent with its market structure, where participants trade against one another rather than against a house. However, there are risks that could challenge current valuation levels. Traditional sportsbooks are actively exploring entry into prediction markets, which could erode Kalshi’s early lead. Recent regulatory pushback from these operators may reflect efforts to delay competition while they build their own offerings.
In addition, a meaningful portion of Kalshi’s volume is estimated to originate from distribution partners such as Robinhood. Control over the end user is a key driver of long term value, and any move by partners to launch competing products could impact Kalshi’s growth trajectory.
Closing Thoughts
Kalshi has established itself as a leading hub for sports prediction markets, with prices that closely track real time developments and converge toward true probabilities ahead of events. This level of pricing accuracy and information efficiency positions it as a credible alternative to traditional sportsbooks.
While higher fees and limited in-game liquidity currently constrain execution, particularly for larger trades, these are likely to improve as competition drives fee compression and stronger liquidity incentives. As depth increases, a reinforcing cycle of higher volume, tighter spreads, and greater market making activity should further strengthen market quality.
With sports acting as the primary driver of volume and engagement, Kalshi’s exchange-like structure and ability to attract informed participants provide a strong foundation for continued growth. Its valuation reflects this positioning, but sustaining it will depend on its ability to scale liquidity and maintain its role as the central hub for sports based event markets.
The information contained in this report and by Blockworks Inc. and related affiliates is for general informational purposes only and is not intended to provide legal, financial, or investment advice. The report should not be construed as an offer or solicitation to buy or sell any security, token, or financial instrument and does not represent any recommendation or endorsement of any investment or financial product or service. Blockworks Inc. and related affiliates are not registered as a securities broker-dealer or an investment advisor in any jurisdiction or country.