Forecasting Market Regimes with the sUSDe Term Structure
Key Takeaways
- As crypto markets mature into a capital-efficient financial system, the sUSDe term structure emerges as a forward-looking signal to gauge market sentiment and forecast market regimes.
- With multiple expirations for sUSDe on Pendle, the market can reveal the implied yield for sUSDe, and in turn the basis, across various points in time out into the future, producing an onchain term structure.
- This term structure reveals the market’s expectations for how the underlying yield and funding rates will change forward out in time, offering a proxy for the long vs. short repositioning in perpetual futures that would affect this.
- The term spread is highly correlated to the underlying yield regime, but produces a significantly stronger signal for returns than the underlying yield alone.
- Historical data supports the hypothesis that the sUSDe term structure can be a valuable leading indicator of changes in the cost of carry, price level of BTC, and all metrics downstream of these.
Funding Rates, Basis, and the Emergence of a Term Structure
Crypto prices are heavily influenced by leveraged trading in perpetual futures. On Binance, the ratio of perp volume to spot for BTC ranged between 6-10x over the past year. The funding rate acts as the mechanism to balance longs against shorts. Elevated funding rates reflect long-skewed positioning and demand for long-biased leverage, while subdued or negative funding reflects bearish positioning.
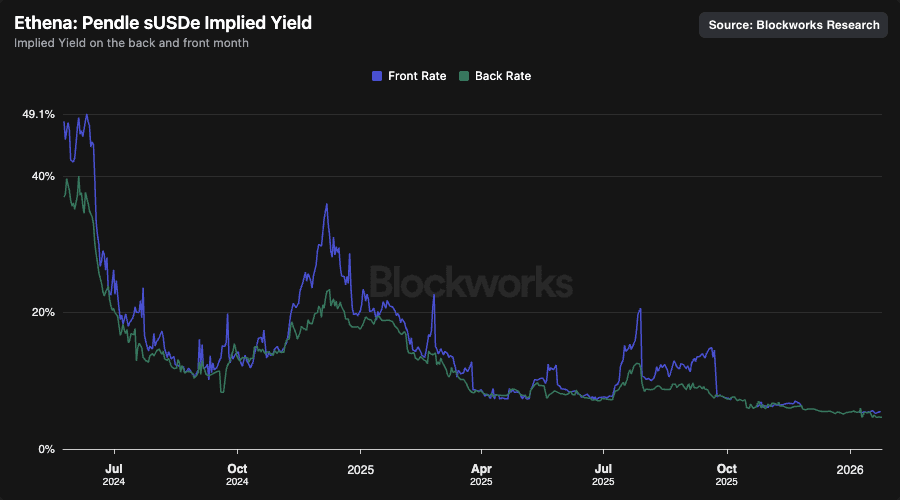
Ethena deploys delta-neutral strategies on perpetual futures markets for BTC and ETH, and the basis is delivered to sUSDe as the underlying yield. With this structure, sUSDe as an instrument effectively captures the basis from funding rates. sUSDe has found its strongest product market fit on Pendle v2, a yield-stripping exchange that lets the market speculate on the product’s underlying yield into set maturities. Historically, 30-70% of the sUSDe supply is utilized on Pendle. While sUSDe pays the underlying yield, earned through the basis, the sUSDe market on Pendle reveals the implied yield, what the market expects the yield to be into a specific maturity date. With multiple expirations for sUSDe on Pendle, the market can reveal the implied yield for sUSDe, and in turn the basis, across various points in time out into the future, producing a term structure.
With sUSDe capturing the basis from funding rates, this term structure reveals the market’s expectations for how funding rates will change over time, offering a proxy for the long vs. short repositioning in perpetual futures that would affect this. In the same way the VIX term structure is a valuable indicator for the forward distribution of volatility on equity indices, or how the 2yr-10yr or SOFR yield curve signals the forward distribution of interest rates, the sUSDe term structure on Pendle reveals a signal to the forward distribution of yields and the changes in corresponding asset price level.
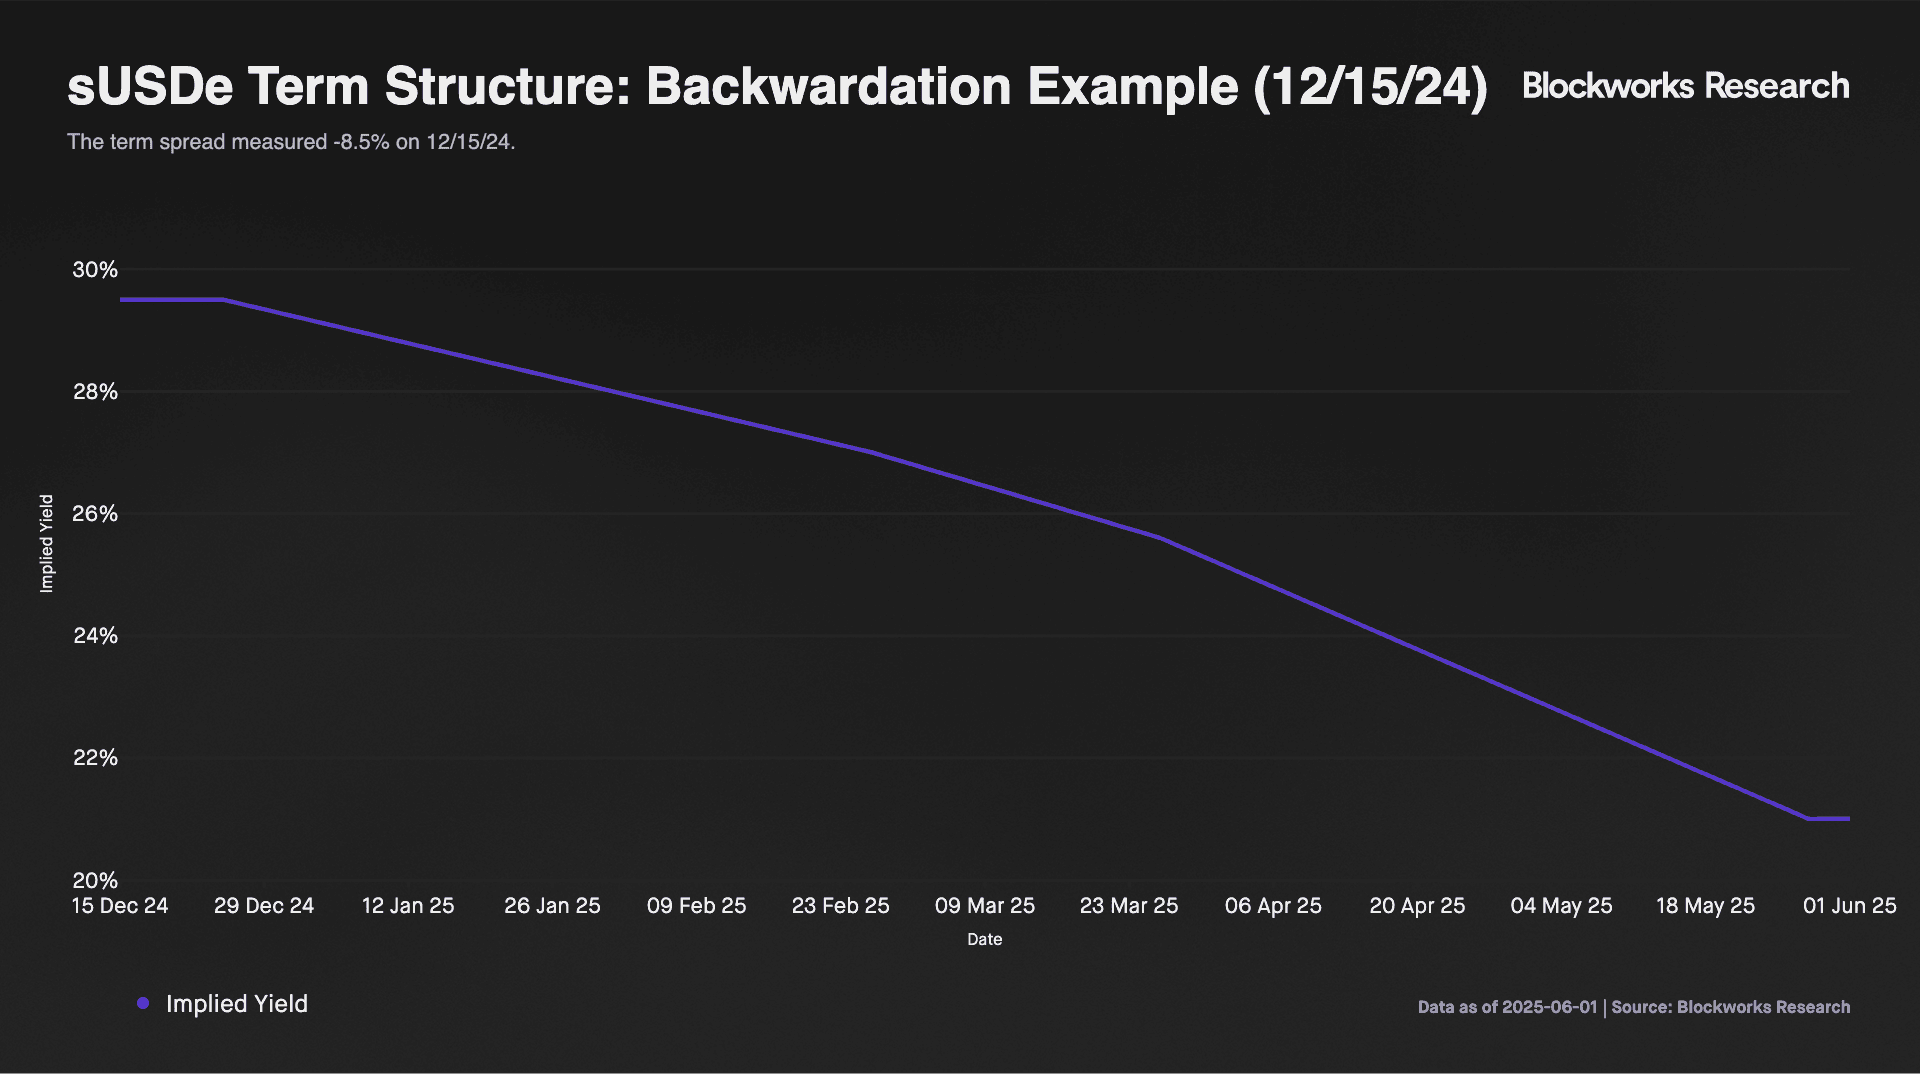
Backwardation
The term structure is downward sloping. The front month implied yield is above the back month, with the market expecting declining funding rates. For an example of backwardation, a snapshot of the term structure on 12/15/24 is provided below, where the front month implied yield was at 29%, while the back month was at 20.5%.
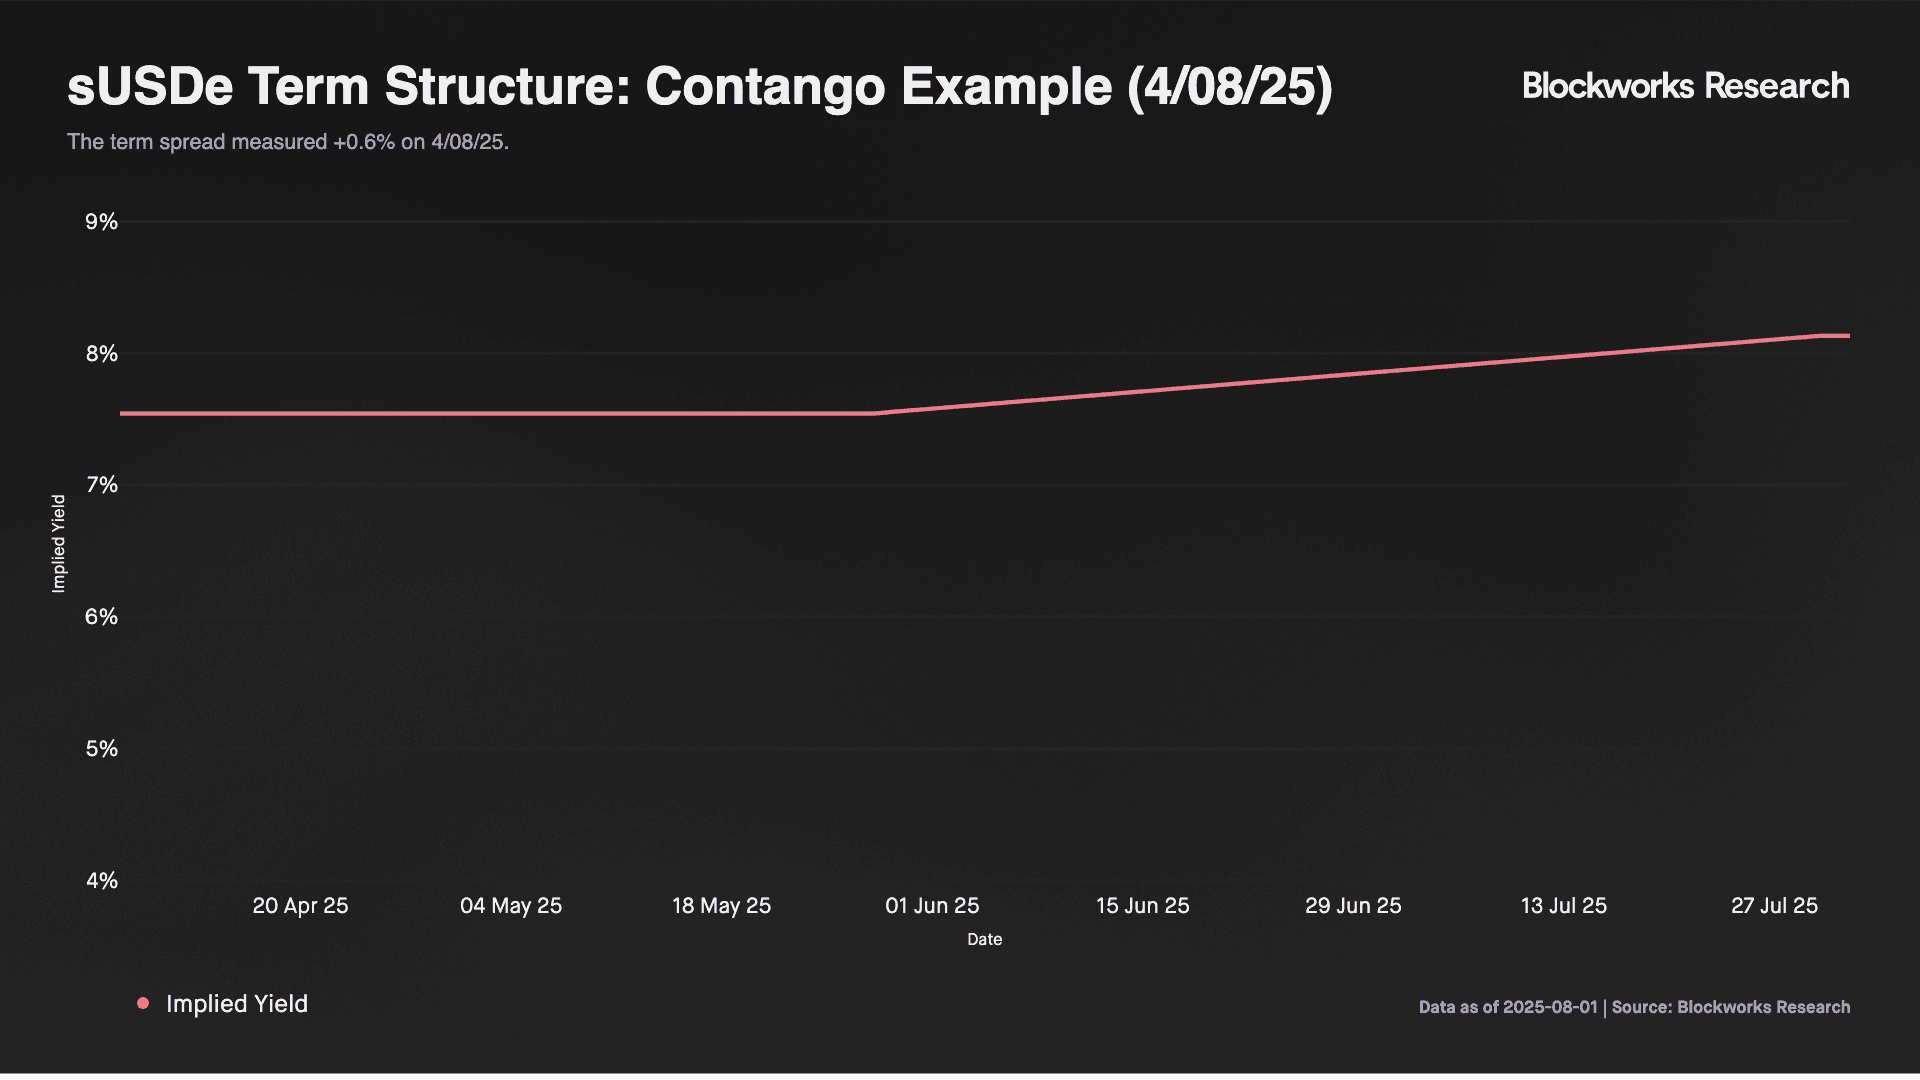
 Contango
The term structure is upward sloping. The front month implied yield is beneath the back month, with the market expecting rising funding rates. For an example of contango, a snapshot of the term structure on 4/08/25 is provided below, where the front month implied yield was at 7.55%, while the back month was at 8.13%.
The sUSDe term structure reveals how the market expects funding rates to change out into the future and, in turn, this yield curve can be used to infer how leveraged positioning in BTC and ETH may change in time. Steep backwardation or contango in this yield curve can serve as a valuable indicator for how the carrying cost and price of BTC might change looking forward.
The Term Spread as a Forward-Looking Signal
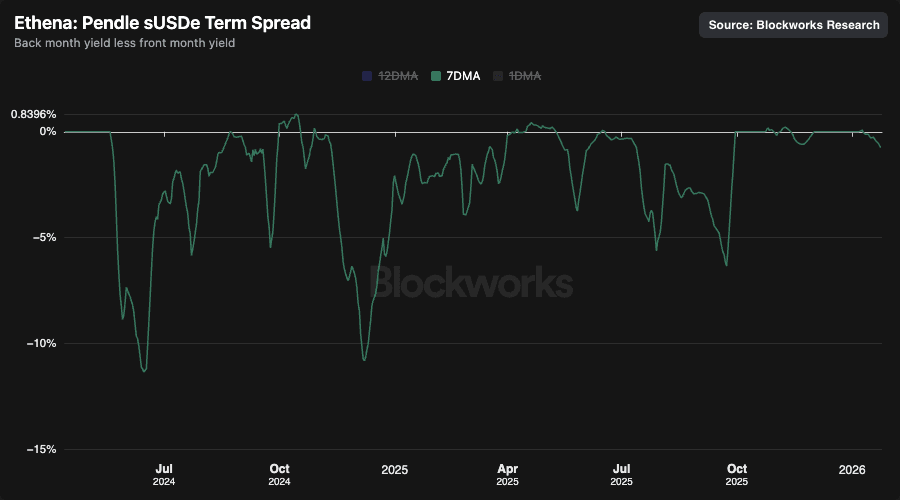
The term structure can be viewed at any point in time when multiple maturities are present. To view the change in the term structure over time, we produce the rolling term spread, measured as the difference between the back month implied yield less the front month implied yield for sUSDe maturities exclusively on Ethereum mainnet.
Additionally, the first and last values of each maturity are eliminated to remove outlier pricings incurred during market initialization and maturity events, and points in time for which there is only one maturity record a term spread value of zero. Positive values for the term spread, where the back month implied rate is above the front month, reflect contango, while negative term spread values, with the back month implied yield beneath the front month, reflect backwardation. Below we show the rolling term spread over time, measuring the spread between the back month and the front month on a 7dma basis.
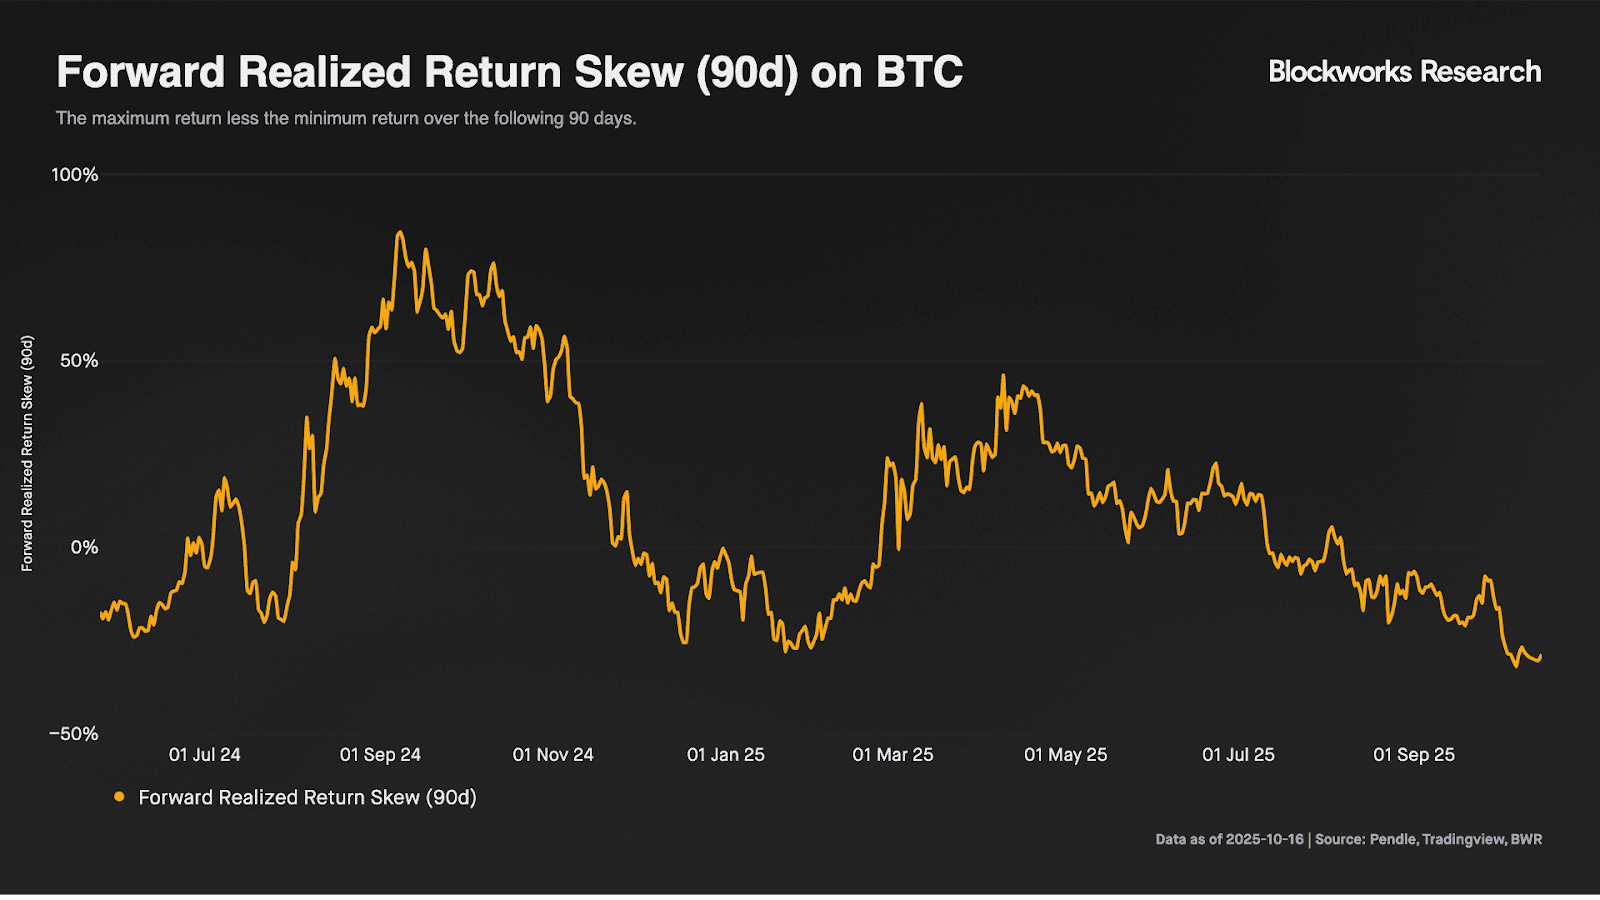
We then sought to quantify to what extent the level of the term spread could indicate the forward realized returns on BTC. For this analysis, we developed a forward realized return skew metric, which measures the difference between the return on the maximum price and the minimum price of BTC over the following 90-120 days. For example, if the maximum return over the following 90 days was +20%, while the minimum return was -10%, the metric would read as +10%. If the maximum return over the following 90 days was 20%, while there was zero downside, the metric would read as +20%. The rolling forward realized return skew on BTC is shown below.
We then examine both metrics, seeking to quantify to what extent the level of the term spread can forecast positive or negative returns and return skew for BTC over the following 90-120 days. We observe a positive relationship between the term spread and forward realized returns. Examining the scatter plot of term spread observations against the forward realized return skew(120-days), we observe overwhelmingly positive return skew coming from contango and positive term spread values. Conversely, we exclusively observe negative return skew coming from steep backwardation and term spread values beneath -7%.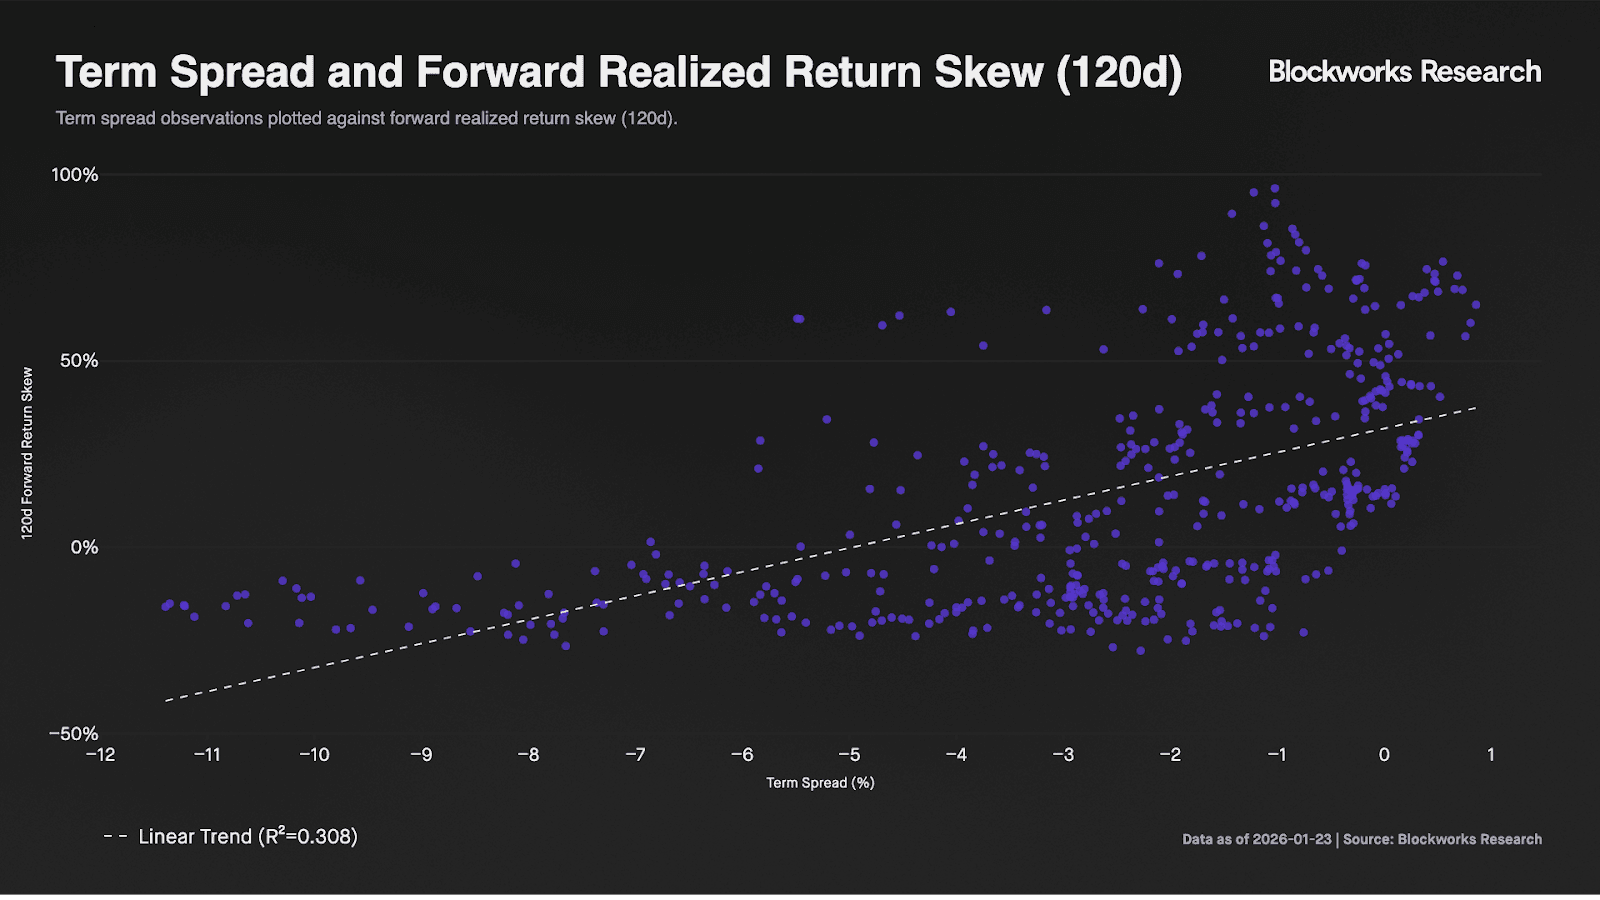
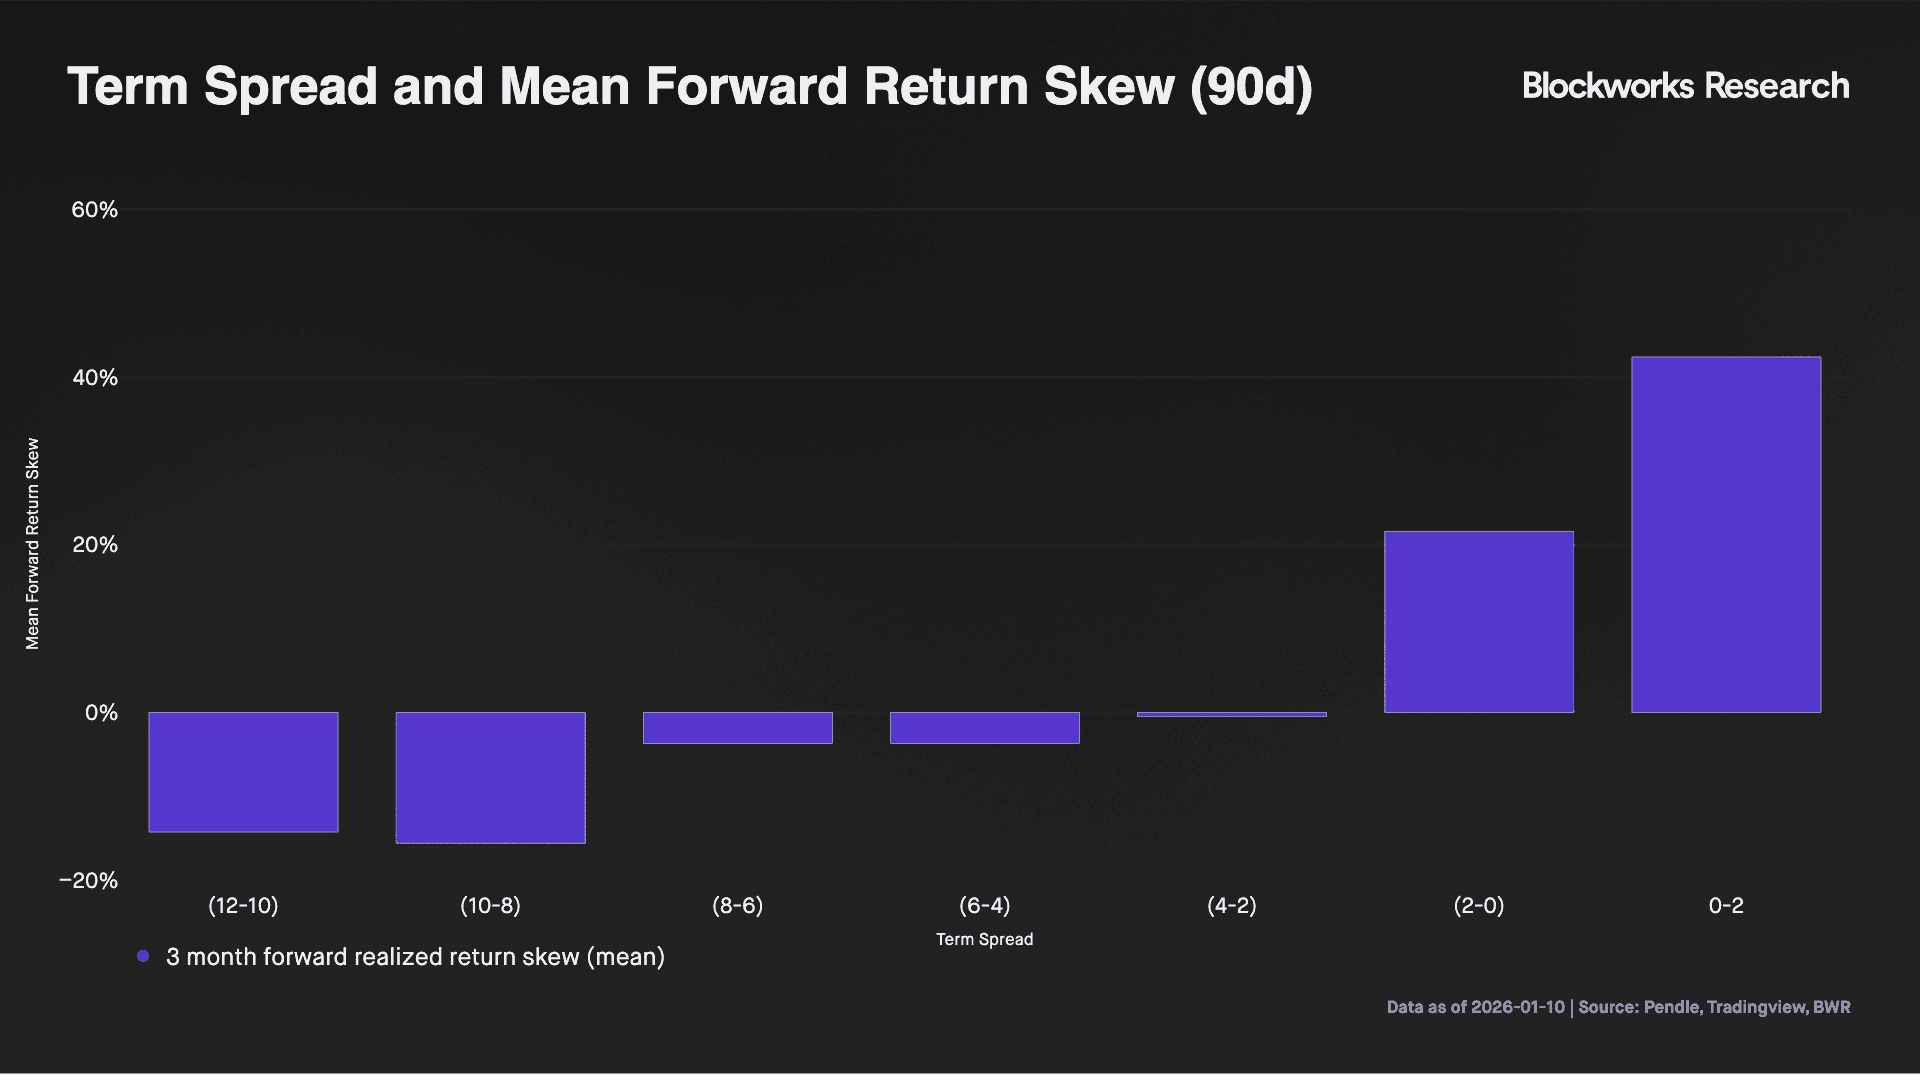
We then bucket term spread observations into 2% buckets, and record the mean forward return skew of the observations within that bucket. Here, backwardation and large negative term spread values coincide with the most negative returns, while contango and positive term spread values coincide with the most positive returns.
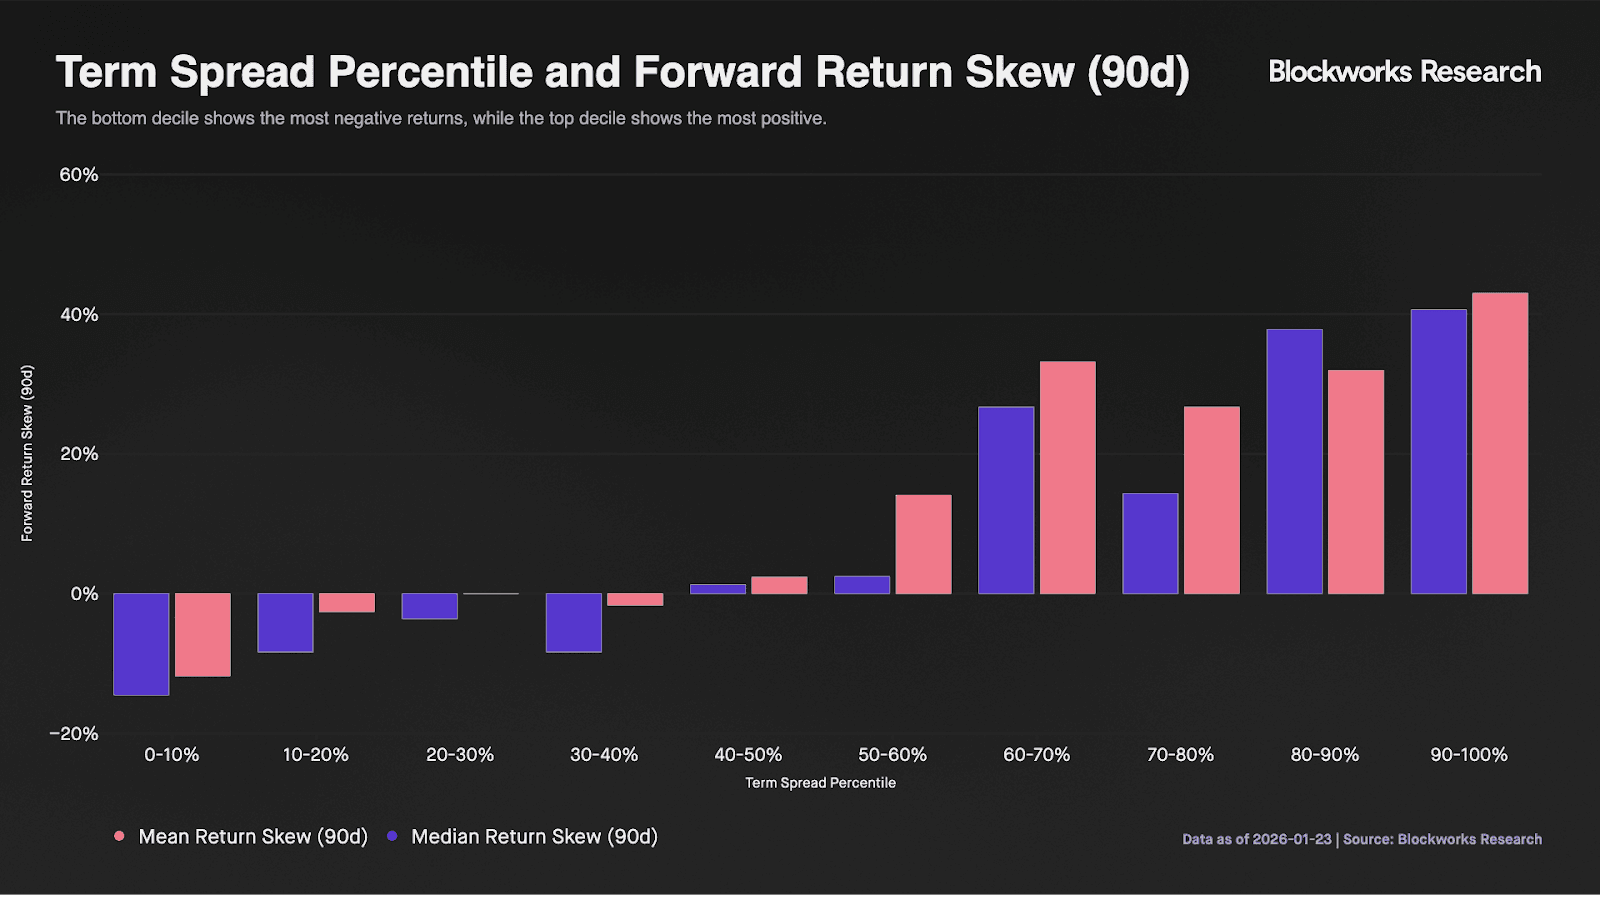
In the following, we assign a percentile rank to each term spread observation based on its historical distribution, and bucket the observations by decile. The X axis is the level of the term spread by decile, while the Y axis shows forward realized return skew. The column values then show the mean and median realized 90d return skew observed by that term spread decile.
Here, the relationship is very clear. Steep backwardation, or large negative values on the term spread, precede the most negative returns over the coming 90 days, and as we move to the right on the X axis towards contango and positive values on the term spread, we see the most positive forward return skew.
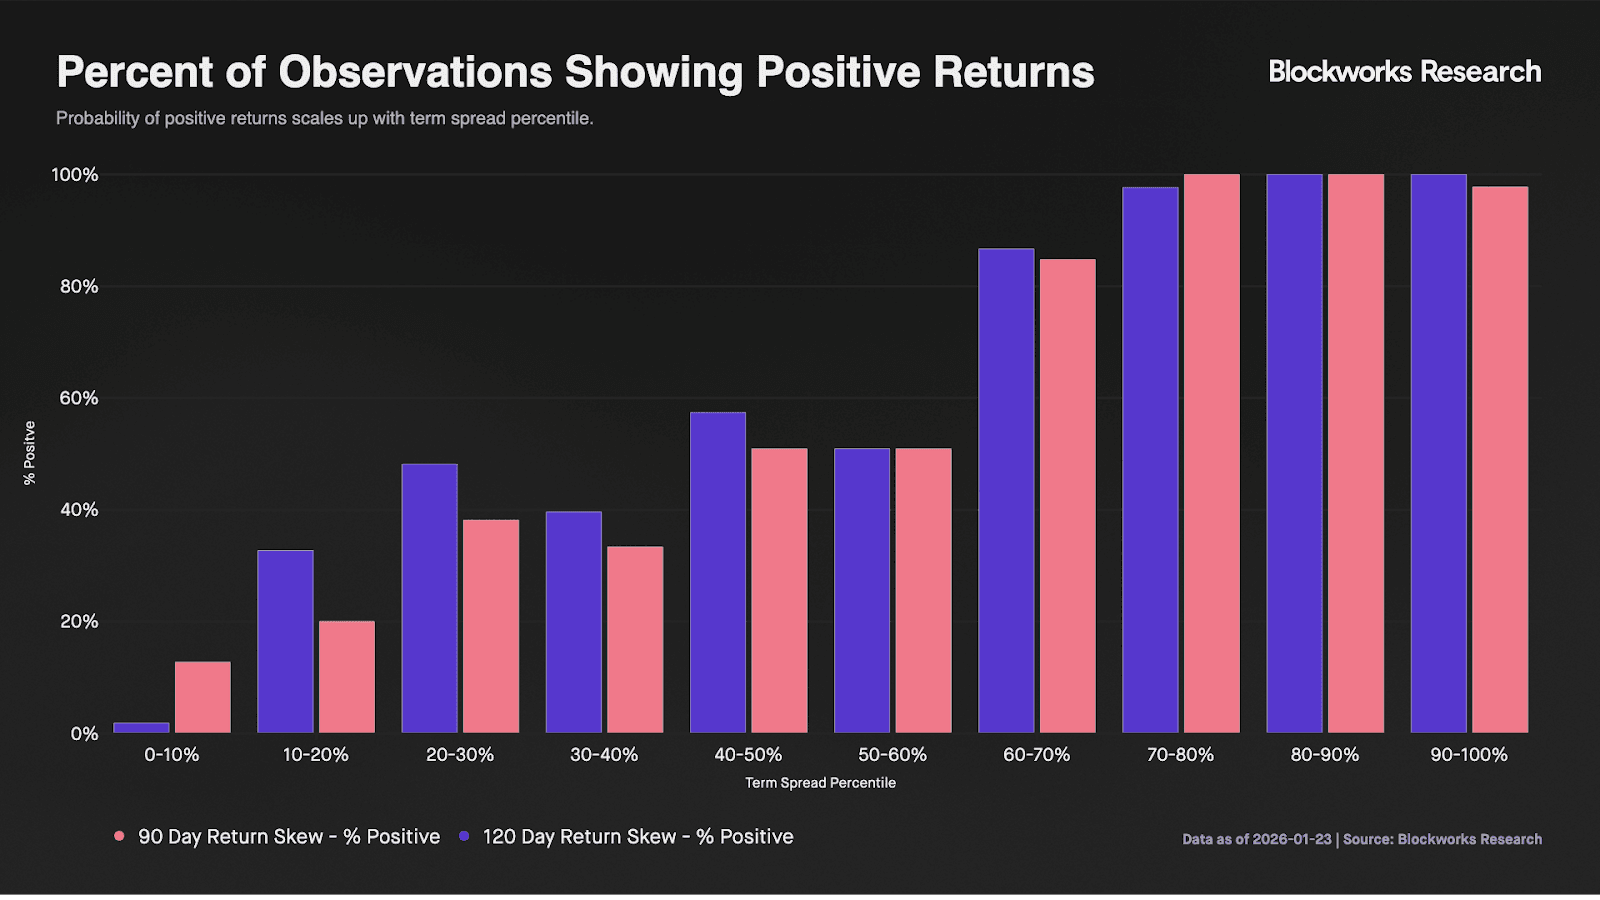
Additionally, in the next chart, we show what percentage of observations within that term spread decile recorded positive returns. The right tail of the term spread and contango showed an overwhelmingly higher incidence of positive return skew. Over 80% of the observations showed positive return skew when the term spread was above its 60th percentile. Inversely, the probability of positive returns collapsed on the left tail of the term spread towards steep backwardation and negative term spread values. Less than 20% of the observations showed a positive 90 day return skew when the term spread was beneath the 20th percentile.
The term structure produces strong signals in the tails of its distribution. Positive term spread values and contango are only recorded in 11.18% of the observations and have historically been bullish indicators, preceding both the highest probability and magnitude of positive forward return skew. Inversely, term spread values beneath -7.5% are only recorded in 7.93% of the observations, preceding both the lowest probability and magnitude of positive forward return skew.
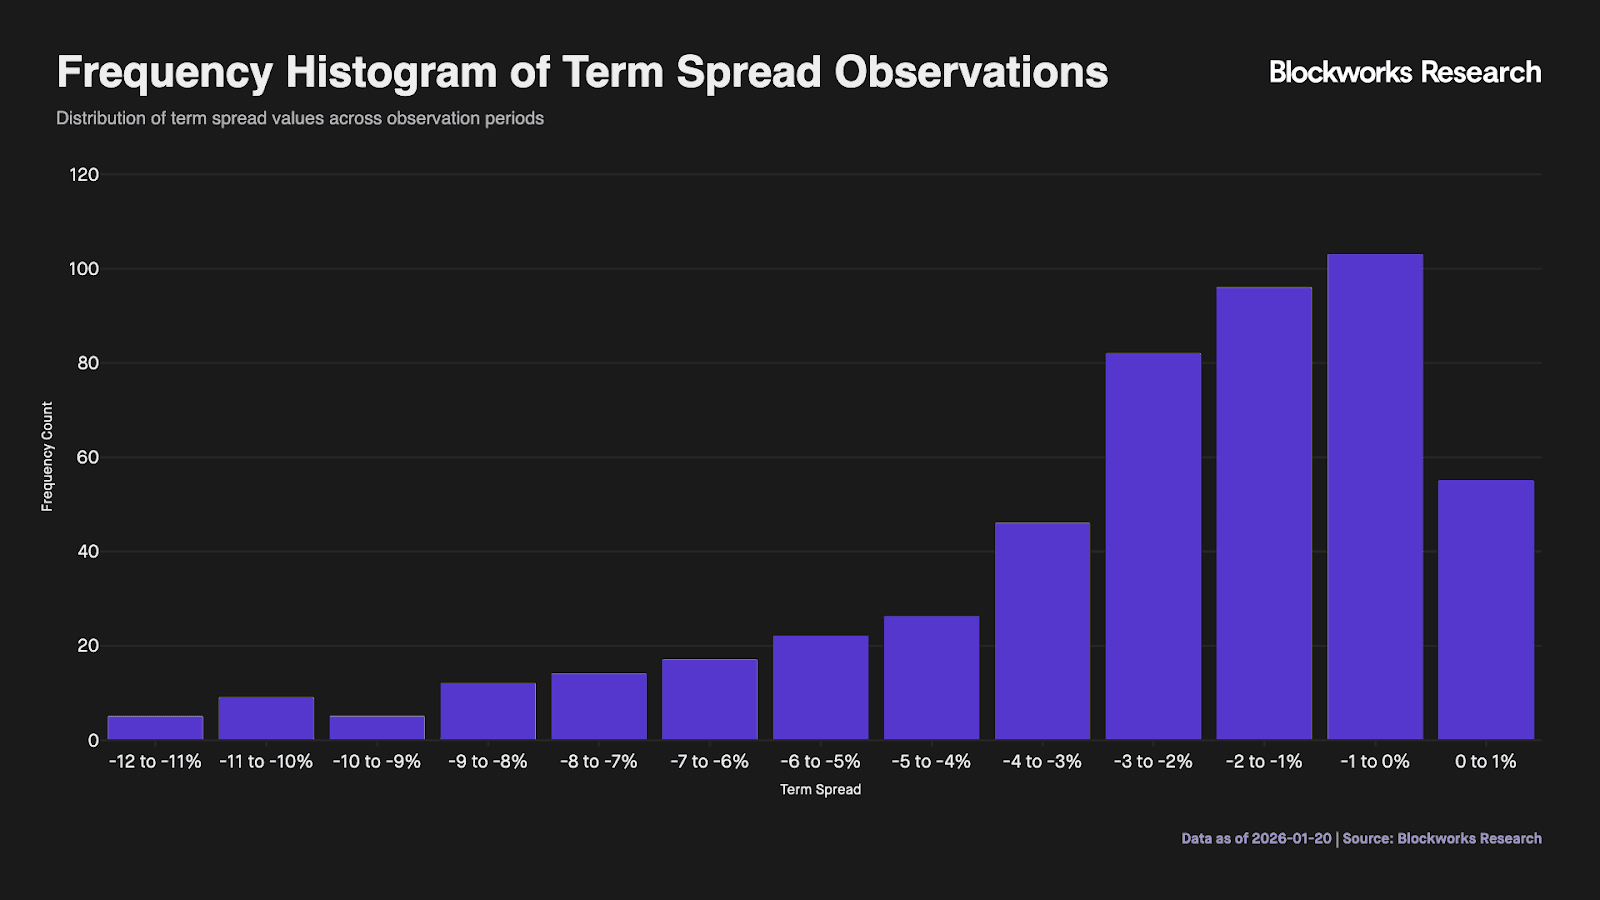
The mean term spread is measured as -2.63%, with the standard deviation measured as 2.71%. The middle of the distribution, and +/- 1 standard deviation from the mean, produce negligible signal; mean returns are about zero, and the probability of positive returns is around 50%. Instead, the right tail of the term spread precedes the right tail of forward returns, while the left tail of the term spread precedes the left tail of returns.
Our findings support the hypothesis that the term spread may be a valuable indicator of forward returns, with contango offering a bullish signal while backwardation is bearish.
The Signal Is in the Shape
The occurrence of contango and steep backwardation are heavily influenced by the level of the underlying yield. While the front month pricing fluctuates significantly with current market conditions, the back month pricing, holding more duration, reflects the expectations for longer-run distribution of the underlying yield.
The underlying sUSDe yield shows a strong inverse relationship to the term spread, with an r^2 of 0.6. Low underlying yield regimes correspond with a low or positive term spread, while high yield regimes correspond with more negative term spreads and steep backwardation.
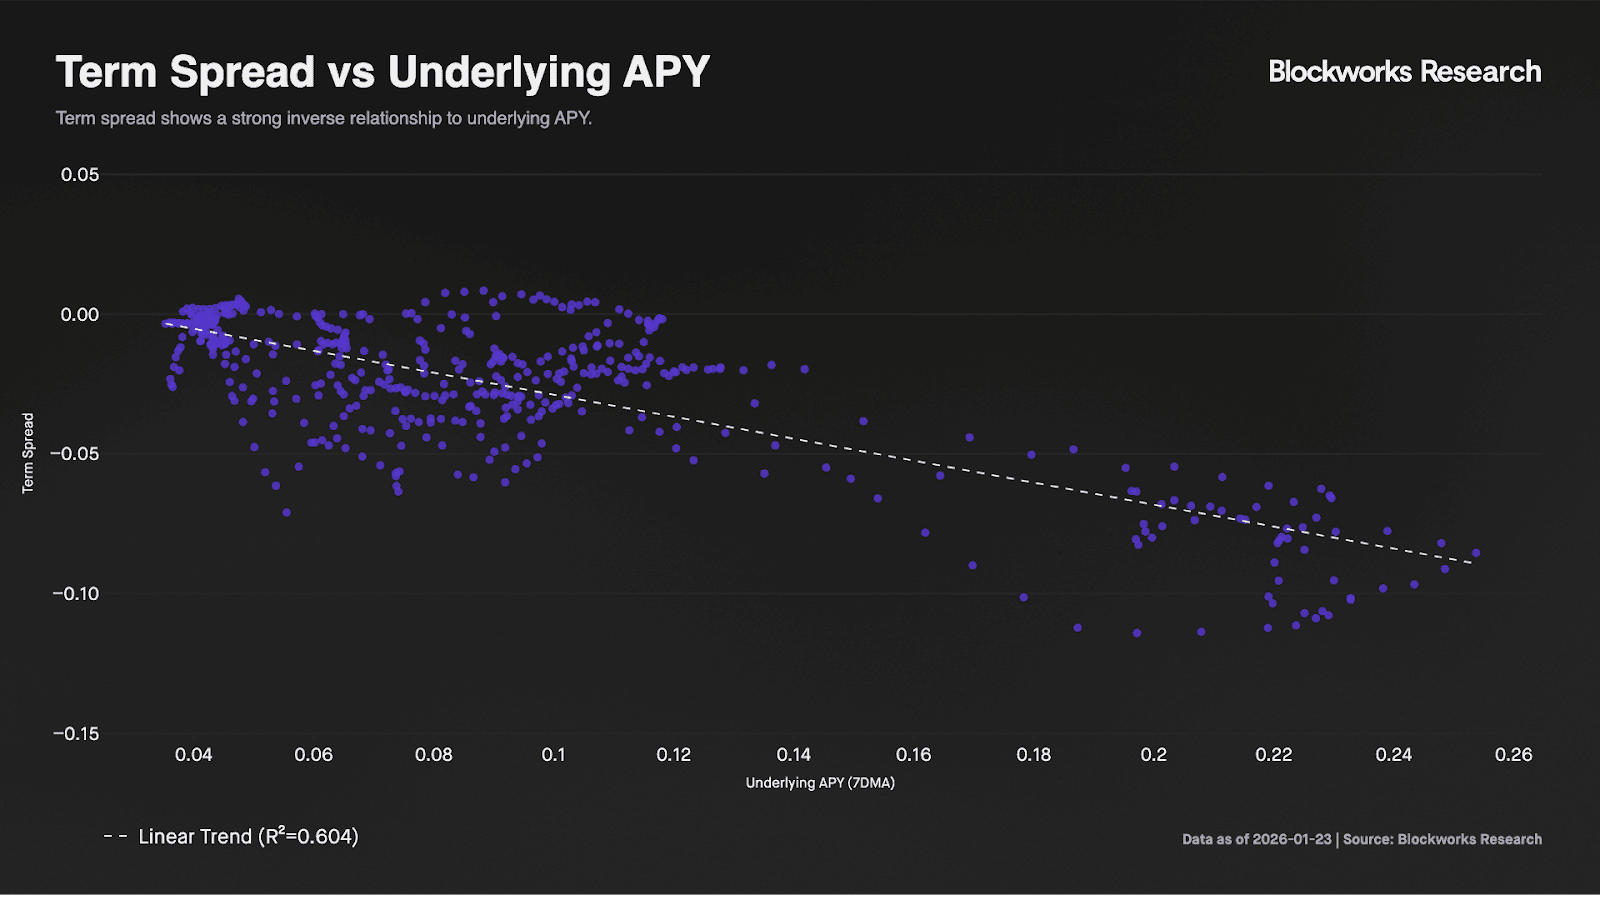
Contango is meaningfully overrepresented in low-yield regimes. Seventy-six percent of contango observations occur when the underlying APY is below its mean of 9.29%.
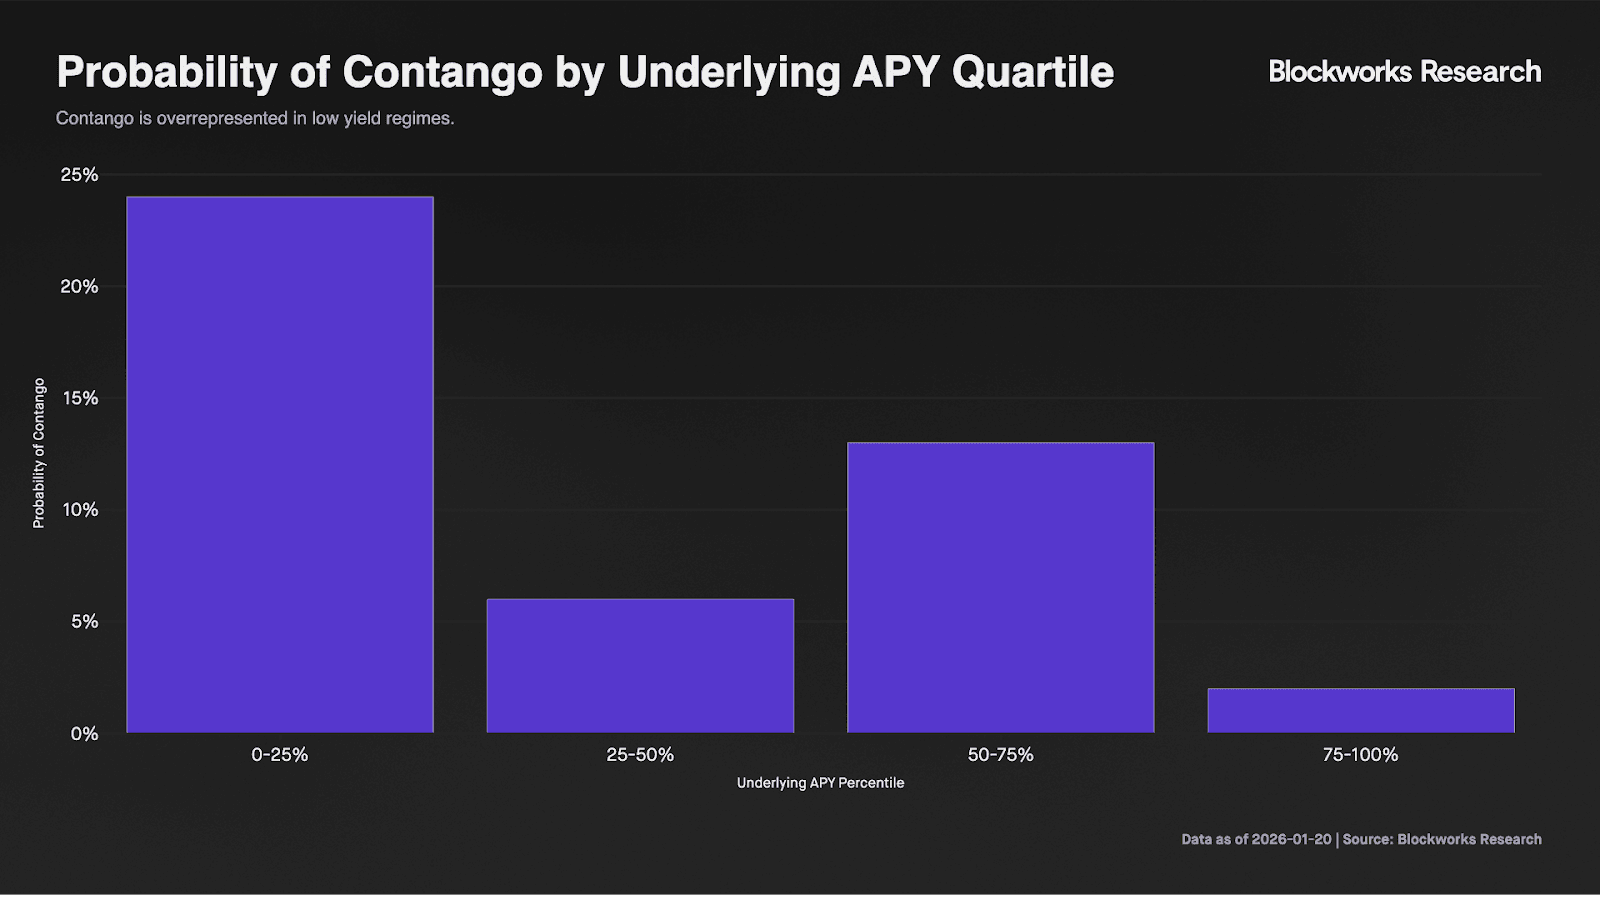
Conversely, steep backwardation is meaningfully overrepresented in high-yield regimes. Eighty-seven percent of steep backwardation observations (term spread < −5%) occur when the underlying yield is above its mean. Contango is rarely observed in high-yield regimes, while steep backwardation is rarely observed in low-yield regimes. In the top decile of the underlying yield distribution, steep backwardation appears in 100% of observations.

This asymmetry reflects the information embedded in the back month of the term structure, which carries more duration and therefore more weight on longer-term yield expectations. In low-yield regimes, contango signals that the back month is pricing yields to revert higher towards their long-run distribution. In high-yield regimes, backwardation signals the opposite: the back month is pricing yields to revert lower.
In this way, the back end of the curve consistently points toward mean reversion in yields, offering a forward-looking signal about where yields are most likely to settle.
Given the relationship and high correlation between the term structure and the underlying yield, we then sought to quantify to what extent the term spread can explain the forward 90-day return skew in ways that are not already explained simply by examining the level of the underlying yield. We performed a horse race regression to test whether the term spread still matters once the underlying yield is accounted for.
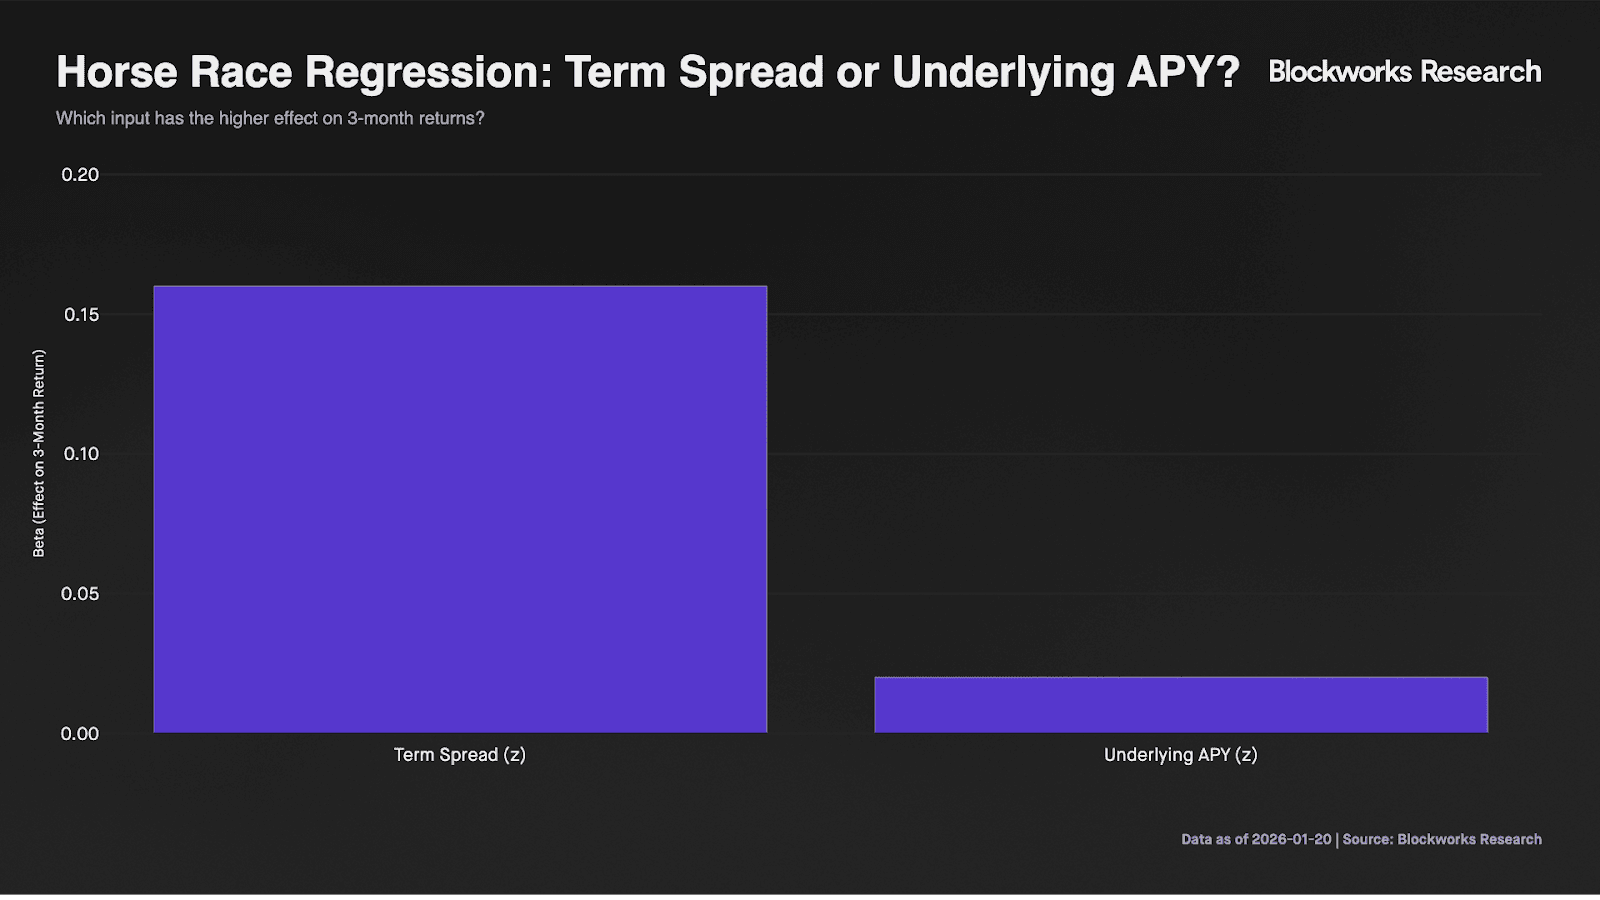
We find that the term spread wins the horserace. APY is significant by itself, but once term spread is included, APY’s incremental effect collapses, while Term Spread remains significant. Underlying APY appears predictive in isolation, but that relationship is largely explained by term spread. When both are included, term spread retains significant explanatory power while APY adds little incremental information.
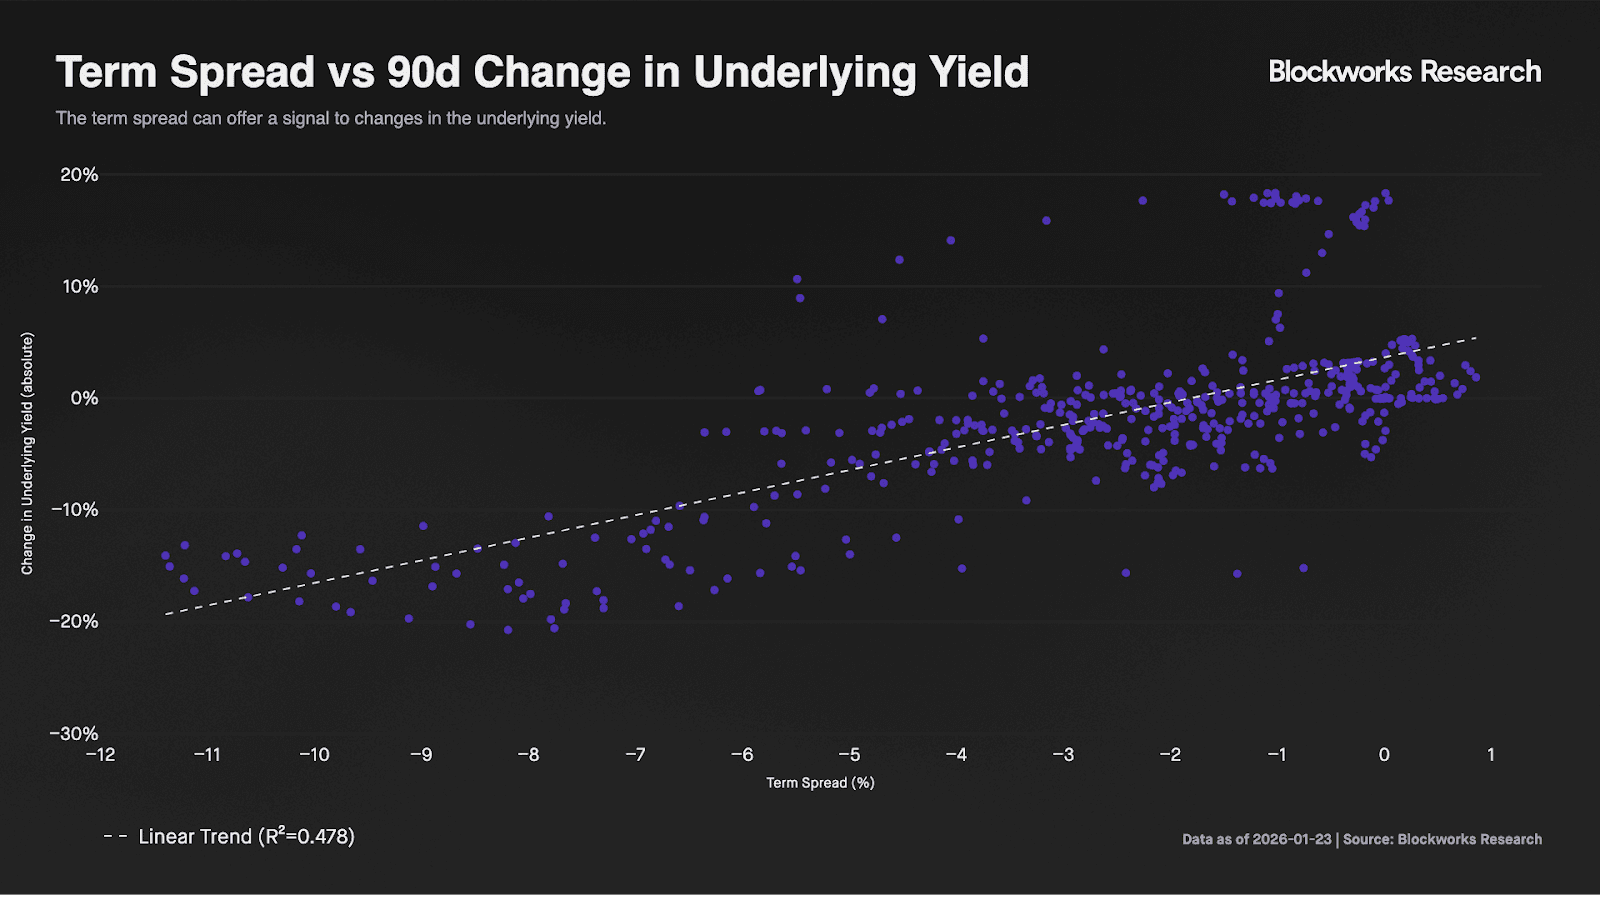
We also find that the term spread can be a valuable leading indicator of changes in the cost of carry and the underlying yield on the 60-90d timeframe. Below, we show the term spread plotted against the 90d change in underlying yield. Here, we see a strong positive relationship. Backwardation, with the market pricing declining yields, consistently precedes declines in the underlying yield.
Further analysis can be done to gain signal on the level term premium or discount, measuring the spread between the implied rate and the underlying yield. We historically observe that both the front month and the back month implied rates tend to price a premium to the underlying yield, while discounts do occasionally occur. 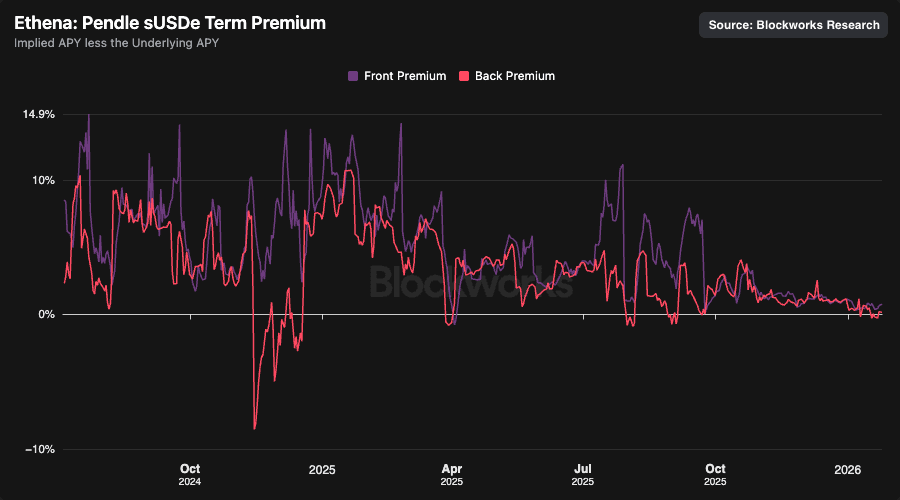
In the same way equity option implied volatility almost always prices a premium to realized volatility, and how dated futures tend to trade at a premium to the settled price, we see the same to be true for sUSDe’s implied rates on Pendle v2, almost always implying a premium to the underlying yield. PTs are short the entire right tail distribution of yields beyond the implied rate and receive a premium for forgoing this upside. Meanwhile, YTs are long the right tail of the underlying yield distribution, long volatility, and have convex payout curves with respect to the underlying. In a pre-Boros onchain economy, the sUSDe-YTs were perhaps the largest, most precise, and most liquid public market hedge to the carrying cost of a long BTC or ETH perp position.
Risks and Limitations
sUSDe on Pendle remains a novel financial primitive. The first market launched in March 2024, leaving less than two years of history and a limited number of observations across regimes of contango and steep backwardation. At various points, only a single sUSDe maturity is listed, eliminating an observable term structure altogether. The metric is not precise enough to offer a "trading signal," but it can point towards probable distributions for forecasting purposes. As such, the term structure should remain one metric or component within a larger and more comprehensive evaluation of how market regimes may change.
Implied yields on sUSDe Pendle markets are also partially influenced by Ethena’s Sats program, raising open questions about the durability and organic demand for this instrument absent incentives. While Sats appear to contribute some implied premium — potentially reflecting ENA call or put skew — this effect is highly correlated with the three-month basis and is explained away once that variable is incorporated. This reinforces that term structure expectations, rather than incentive effects, are the dominant driver of observed pricing dynamics.
Additionally, the Aave listing of sUSDe-PTs in the summer of 2025 offered a significant demand and distribution venue for the instruments, particularly the front month. This listing and the corresponding demand, both for that point in time on the curve and going forward, could dampen the magnitude of the front month premium and the term spread. For example, the term spread in the July-September 2025 period may have measured significantly more negative values than the observed -4% to -6% should there not have been such significant demand for the front month PT. Going forward, the potential absence of a Sats program, coupled with the continued listings and demand for sUSDe-PTs on money markets, could mean that the term spread produces signals at levels that are materially dissimilar from the historical sample set.
All yields in the analysis are measured on an annualized basis. However, the duration between the front- and back-month maturities is non-constant. At times, the maturity gap is approximately 30 days; at others, it spans multiple months. As a result, the impact of duration risk on back-month pricing is not explicitly accounted for in the term spread.
The magnitude of the term spread is also sensitive to smoothing choices and discretionary treatment of outlier prices around market initialization and maturity. That said, the results are robust: applying multiple simple moving averages and excluding up to the first four and last three daily yield observations as outliers yields materially similar conclusions regarding the relationship between the term spread and forward realized return skew.
The sUSDe term structure reveals the market’s expectations through what is priced into the curve. While the term spread has, historically, accurately priced the direction of the future distribution of yield, there may come points in time where the curve is priced incorrectly, and the embedded signal is inaccurate. Under these conditions, there is strong incentive to trade against the curve.
Looking ahead, Pendle’s Boros may emerge as a more capital-efficient, liquid, and precise venue for expressing funding rate expectations and constructing a term-structure signal. If Boros achieves sufficient scale, the sUSDe term structure on Pendle v2 may ultimately be supplanted by signals produced there.
Conclusion
The sUSDe term structure on Pendle reveals the market’s expectations channel, offering a forward-looking signal to changes in the cost of carry, price level of BTC, and all metrics downstream of these. Historical data supports the hypothesis that the term structure can be used to forecast market regimes, with steep backwardation signalling a bearish outlook while contango is bullish.
The information contained in this report and by Blockworks Inc. and related affiliates is for general informational purposes only and is not intended to provide legal, financial, or investment advice. The report should not be construed as an offer or solicitation to buy or sell any security, token, or financial instrument and does not represent any recommendation or endorsement of any investment or financial product or service. Blockworks Inc. and related affiliates are not registered as a securities broker-dealer or an investment advisor in any jurisdiction or country.